Copyright
©The Author(s) 2025.
World J Gastroenterol. Apr 7, 2025; 31(13): 102563
Published online Apr 7, 2025. doi: 10.3748/wjg.v31.i13.102563
Published online Apr 7, 2025. doi: 10.3748/wjg.v31.i13.102563
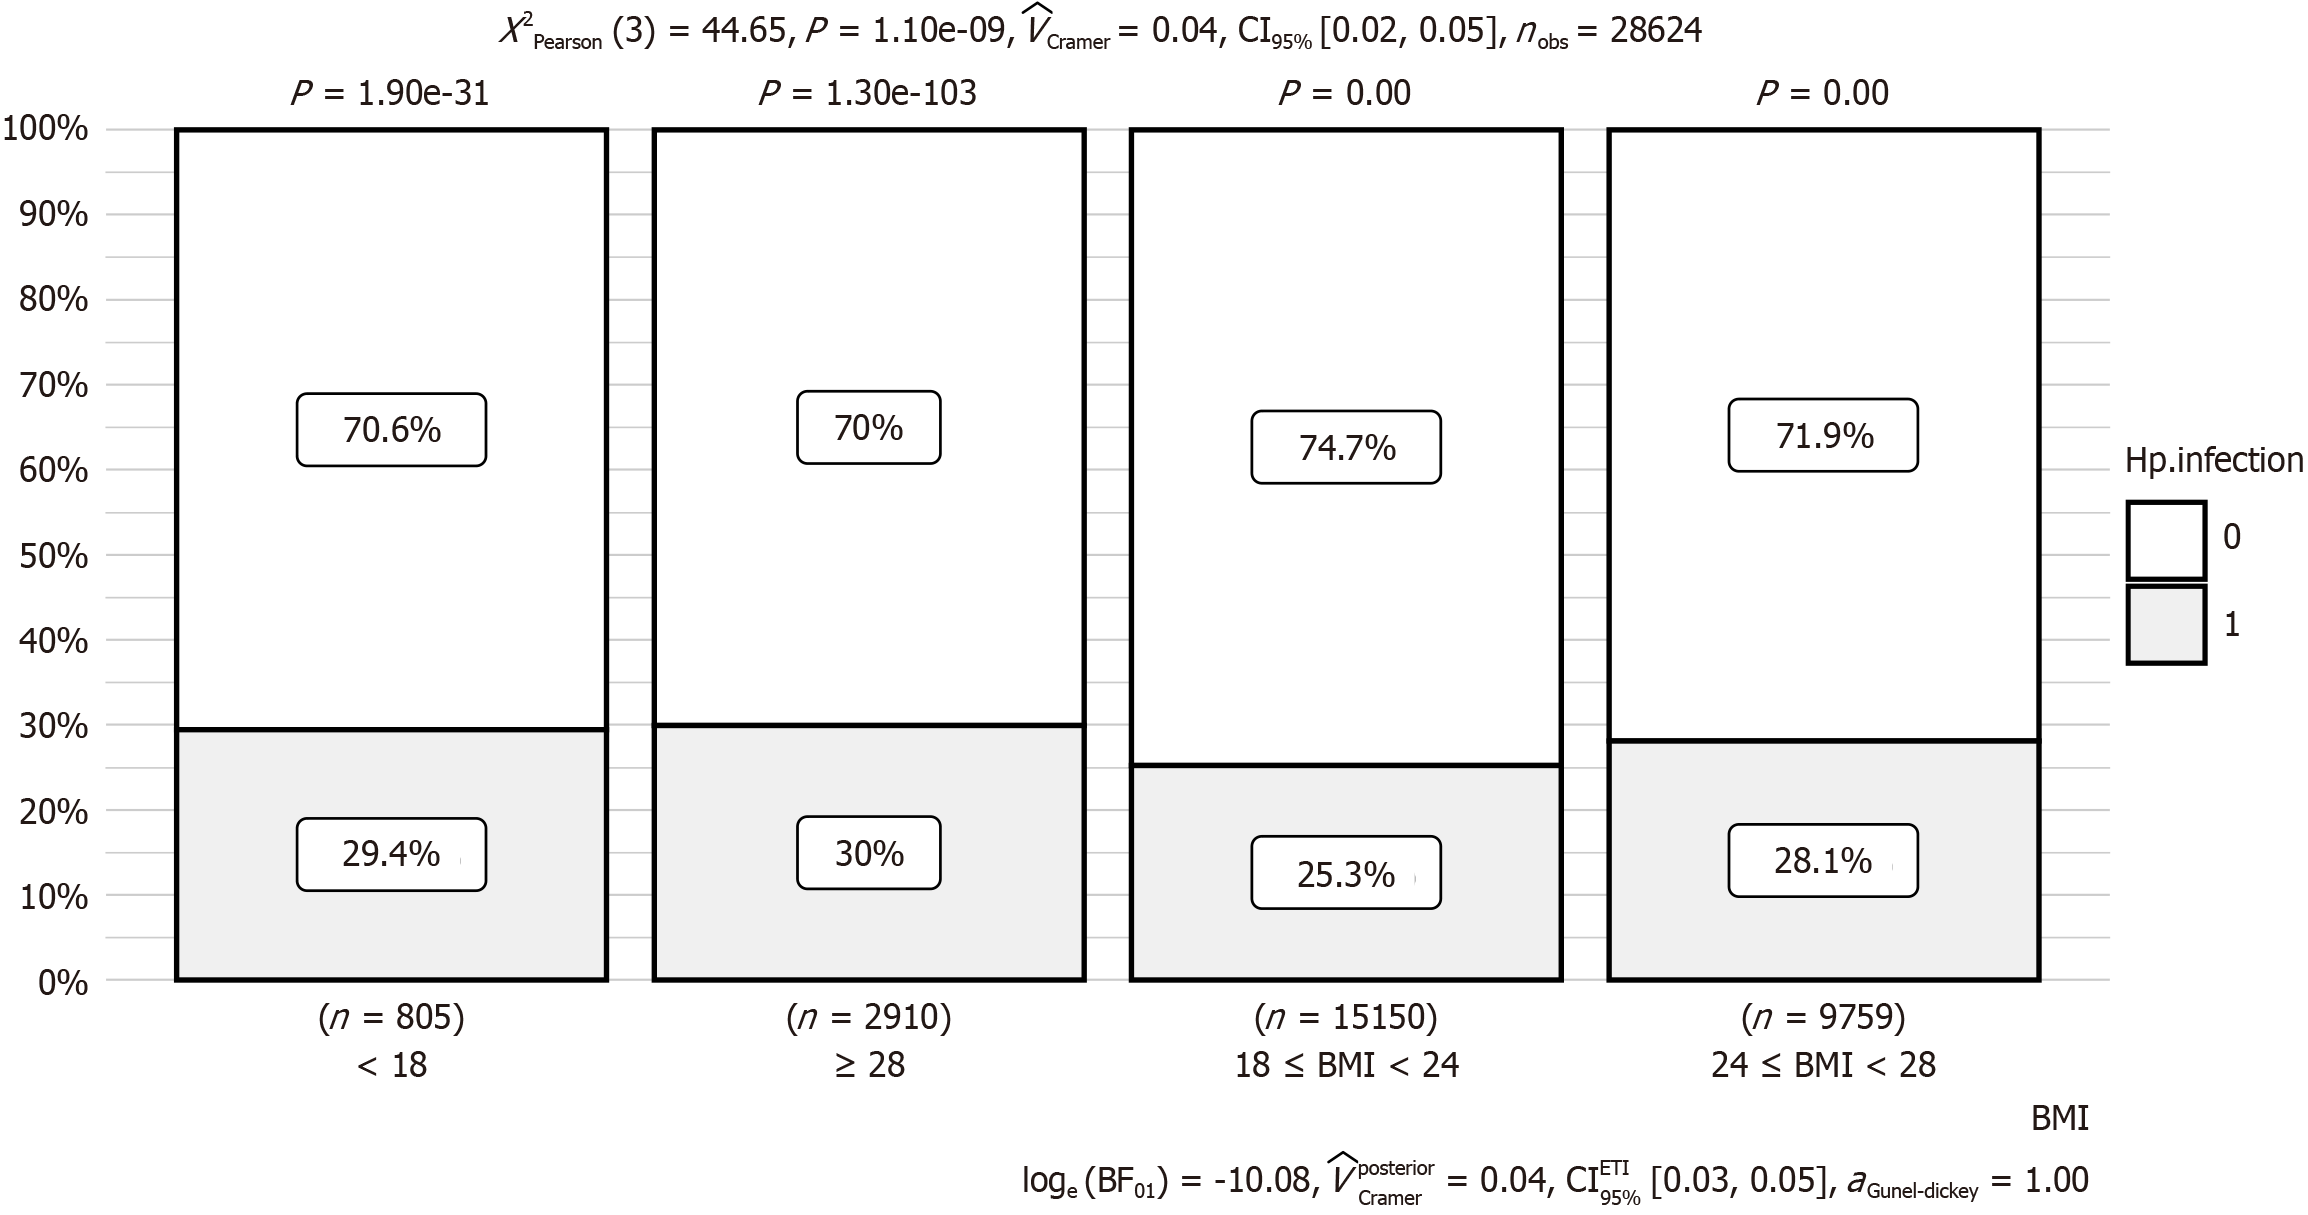
Figure 1 Associations between Helicobacter pylori infection and body mass index.
The χ2 test revealed significant differences in Helicobacter pylori infection rates across body mass index (BMI) groups [χ² (3) = 44.65, P < 0.001]. Cramer’s V = 0.04 (95%CI: 0.02-0.05) suggested a weak association. The Bayesian factor [log(BF01) = −10.08] strongly supported the alternative hypothesis. BMI categories: < 18 kg/m² (underweight), 18-23.9 kg/m² (normal weight), 24-27.9 kg/m² (overweight), ≥ 28 kg/m² (obese). Hp: Helicobacter pylori.
- Citation: Ye L, Yan K, Tian Z, Xiao ZH, Xie RY, Xie ZY, Tao L. Helicobacter pylori infection is linked to metabolic dysfunction and associated steatotic liver disease: A large cross-sectional study. World J Gastroenterol 2025; 31(13): 102563
- URL: https://www.wjgnet.com/1007-9327/full/v31/i13/102563.htm
- DOI: https://dx.doi.org/10.3748/wjg.v31.i13.102563


