Copyright
©The Author(s) 2025.
World J Gastroenterol. Apr 7, 2025; 31(13): 100566
Published online Apr 7, 2025. doi: 10.3748/wjg.v31.i13.100566
Published online Apr 7, 2025. doi: 10.3748/wjg.v31.i13.100566
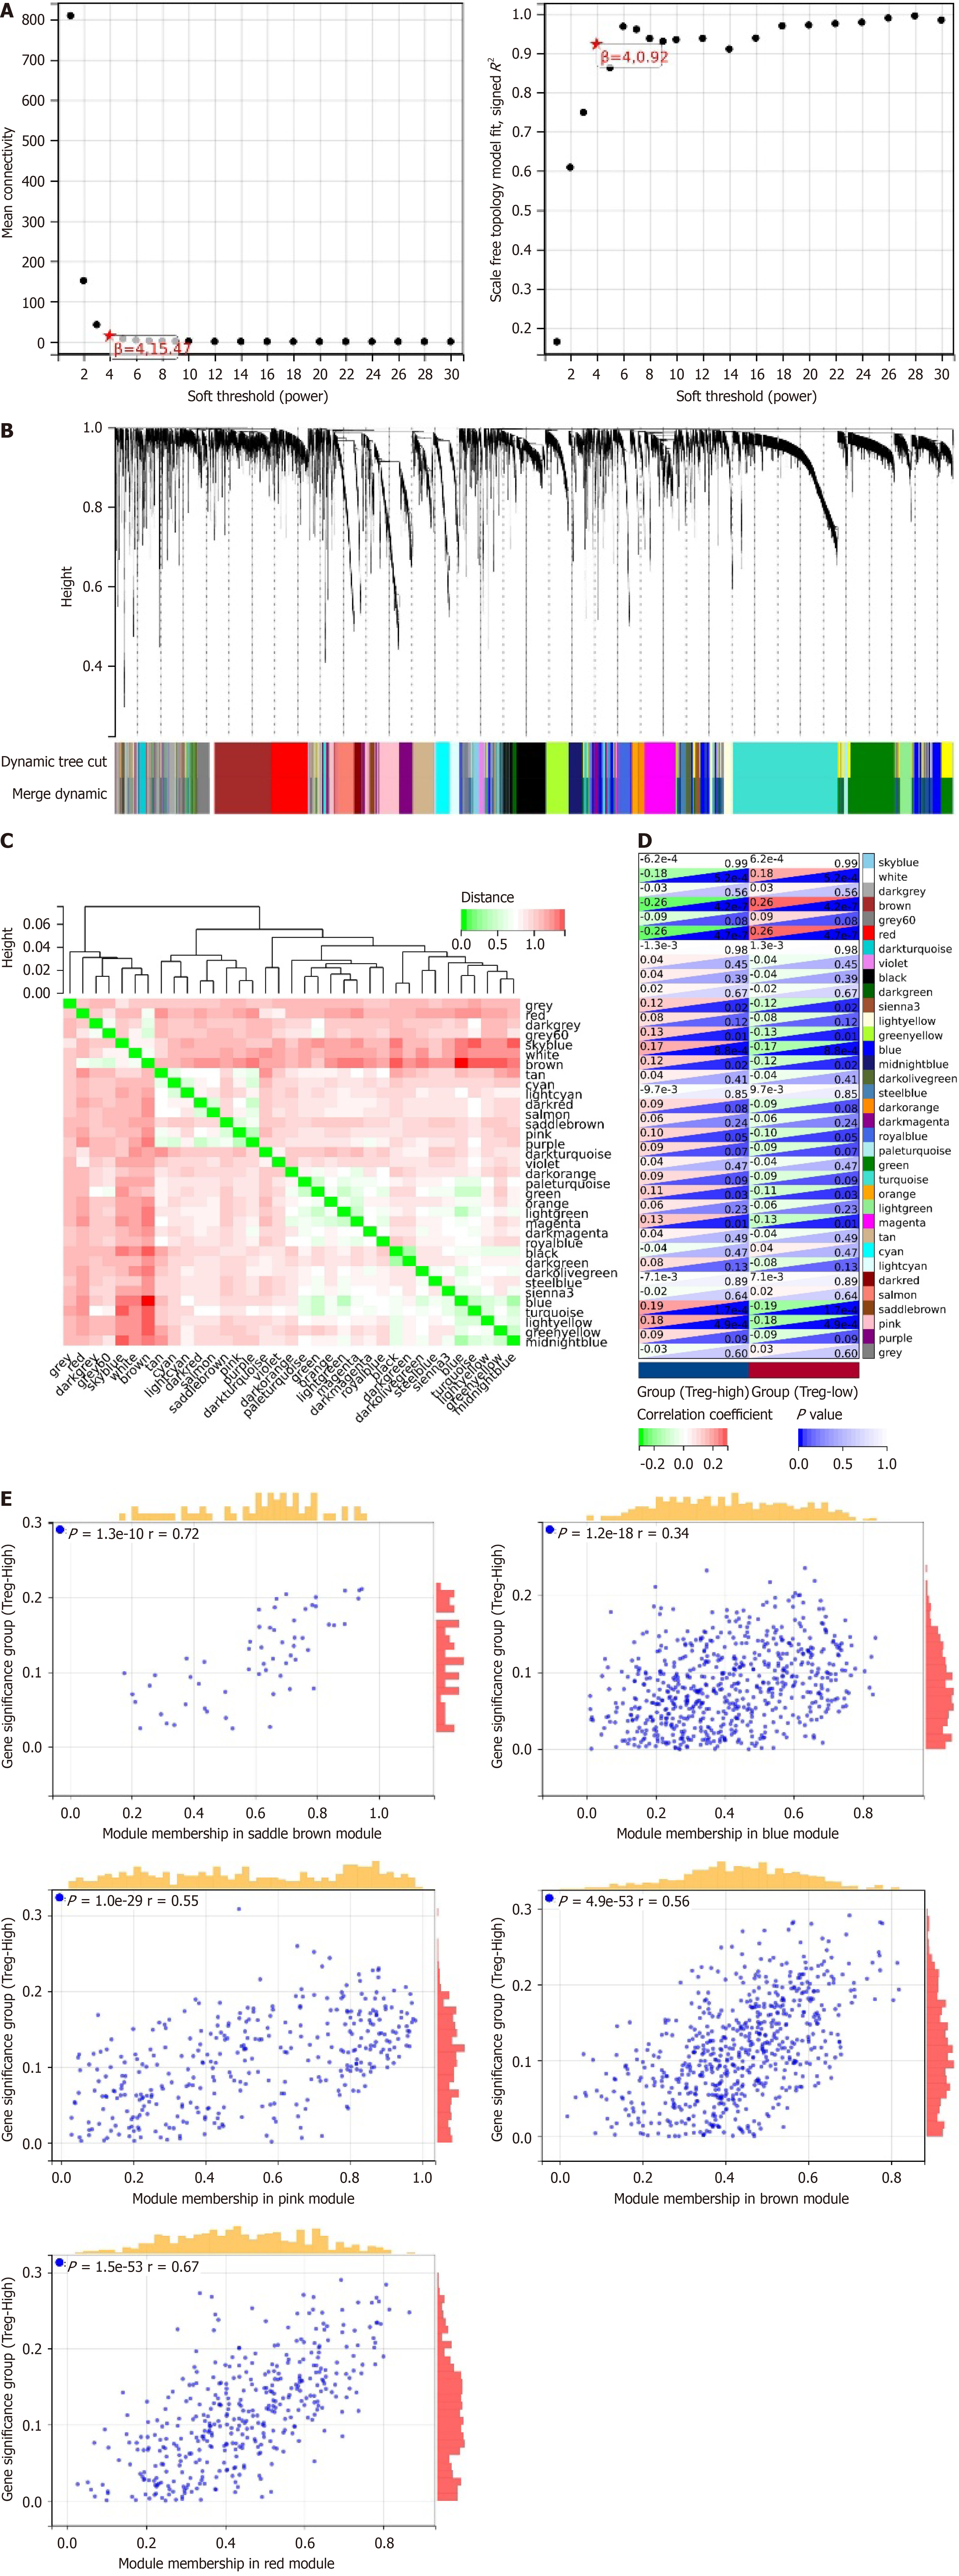
Figure 2 Molecular mechanism of regulatory T-cell infiltration in liver hepatocellular carcinoma.
A: Scale independence (left) and average connectivity (right) to determine the weighted value β = 4 that satisfies the scale-free network law; B: Dendrogram of co-expression network modules; C: Heatmap showing the correlation between 35 modules; D: Correlation analysis between modules and high or low regulatory T-cell (Treg) cell infiltration; E: Scatter plots analyzing the relationship between the brown, red, blue, saddle brown, and pink modules and Treg-High infiltration. Liver hepatocellular carcinoma, n = 373.
- Citation: Lan X, Zhang H, Chen ZY, Wang J, Zhang SC, Li Q, Ke JY, Wei W, Huang R, Tang X, Chen SP, Huang TT, Zhou YW. Suppressor of cytokine signaling 2 modulates regulatory T cell activity to suppress liver hepatocellular carcinoma growth and metastasis. World J Gastroenterol 2025; 31(13): 100566
- URL: https://www.wjgnet.com/1007-9327/full/v31/i13/100566.htm
- DOI: https://dx.doi.org/10.3748/wjg.v31.i13.100566


