Copyright
©The Author(s) 2025.
World J Gastroenterol. Mar 28, 2025; 31(12): 97120
Published online Mar 28, 2025. doi: 10.3748/wjg.v31.i12.97120
Published online Mar 28, 2025. doi: 10.3748/wjg.v31.i12.97120
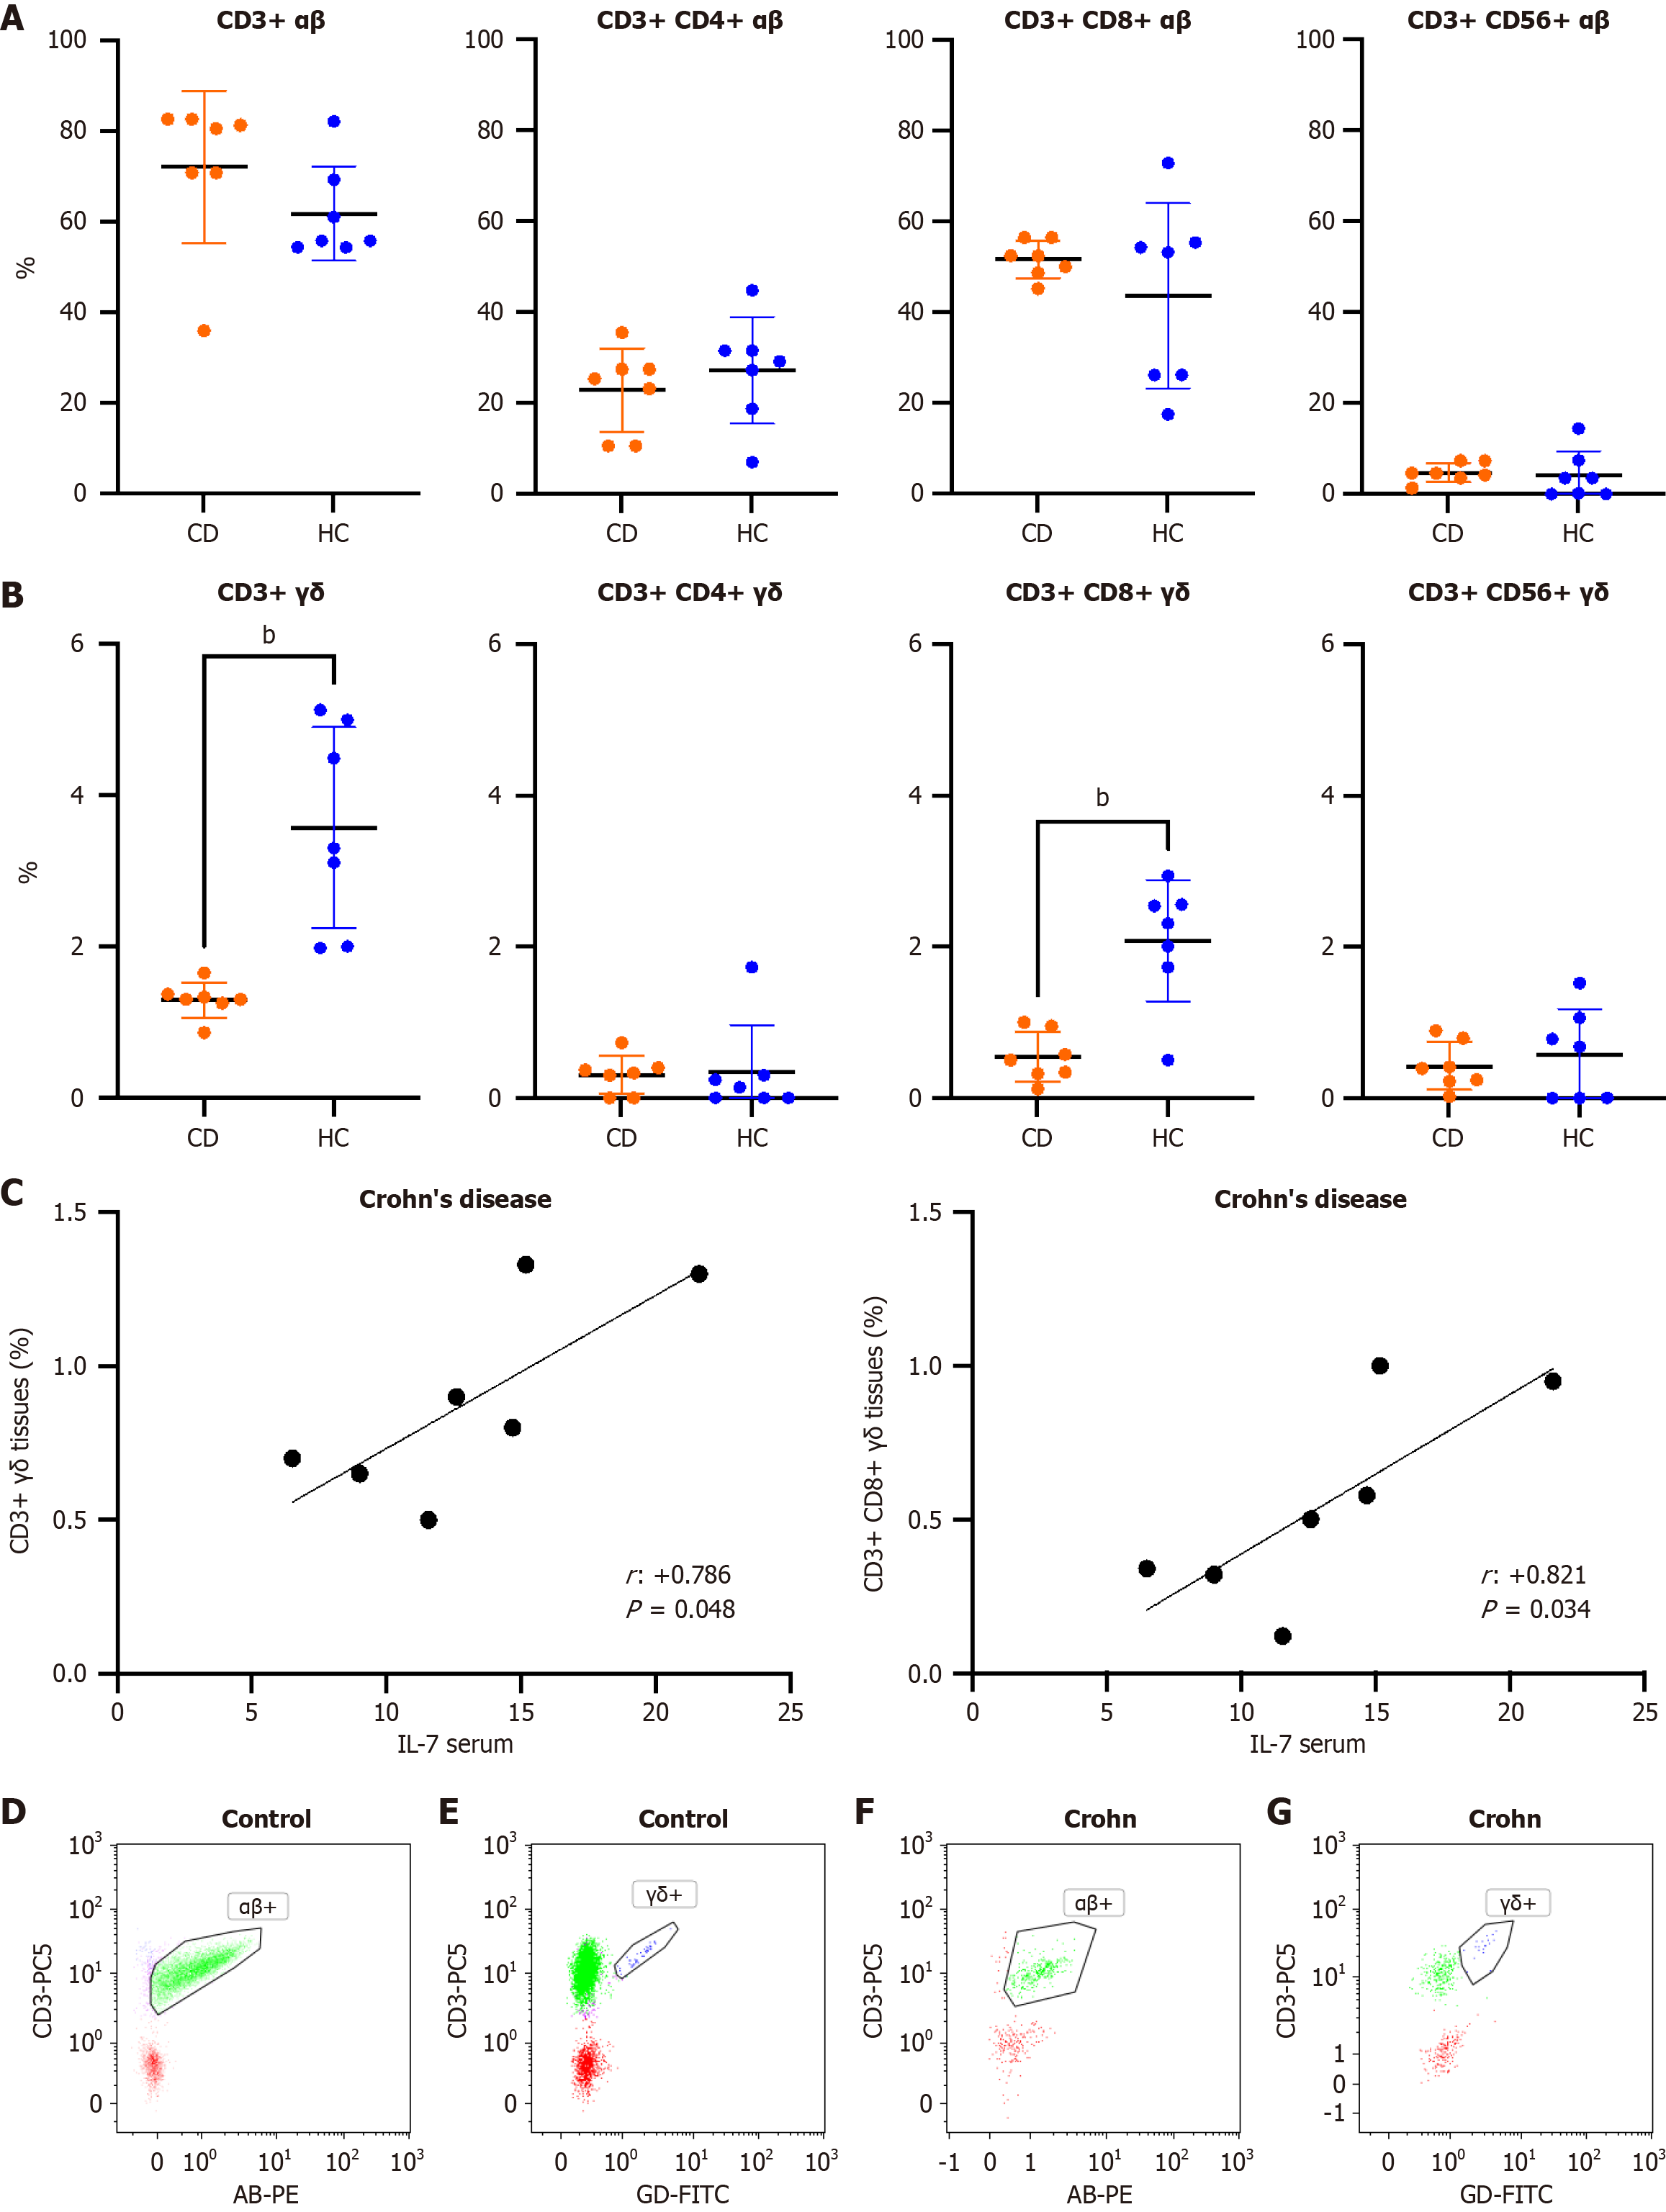
Figure 4 Frequency of T cells subset in tissues (flow cytometry).
A and B: Comparison of αβ T cells (A) and γδT cells (B) in tissues from patients with Crohn's disease (CD) (n = 7) and healthy controls (n = 7). Values are expressed as percentages, and double T bars indicate standard deviation (bP < 0.01). The Mann-Whitney U test was used; C: Relationship of interleukin 7 (IL-7) titers in peripheral blood with γδ T cells in tissues of patients with CD; D-G: Spearman's r test was used. Representative figures of αβ and γδ T cell subsets in tissues from healthy controls (D and E) and patients with CD (F and G) vs T cells were gated based on their low side scatter and high cluster of differentiation 45 (CD45) expression. After selection, we differentiated αβ+ (Panel D and F) and γδ+ (Panel E and G) T cell subsets in CD3 vs αβ/γδ dot plot.
- Citation: Andreu-Ballester JC, Hurtado-Marcos C, García-Ballesteros C, Pérez-Griera J, Izquierdo F, Ollero D, Jiménez A, Gil-Borrás R, Llombart-Cussac A, López-Chuliá F, Cuéllar C. Decreased gene expression of interleukin 2 receptor subunit γ (CD132) in tissues of patients with Crohn’s disease. World J Gastroenterol 2025; 31(12): 97120
- URL: https://www.wjgnet.com/1007-9327/full/v31/i12/97120.htm
- DOI: https://dx.doi.org/10.3748/wjg.v31.i12.97120


