Copyright
©The Author(s) 2025.
World J Gastroenterol. Mar 28, 2025; 31(12): 104952
Published online Mar 28, 2025. doi: 10.3748/wjg.v31.i12.104952
Published online Mar 28, 2025. doi: 10.3748/wjg.v31.i12.104952
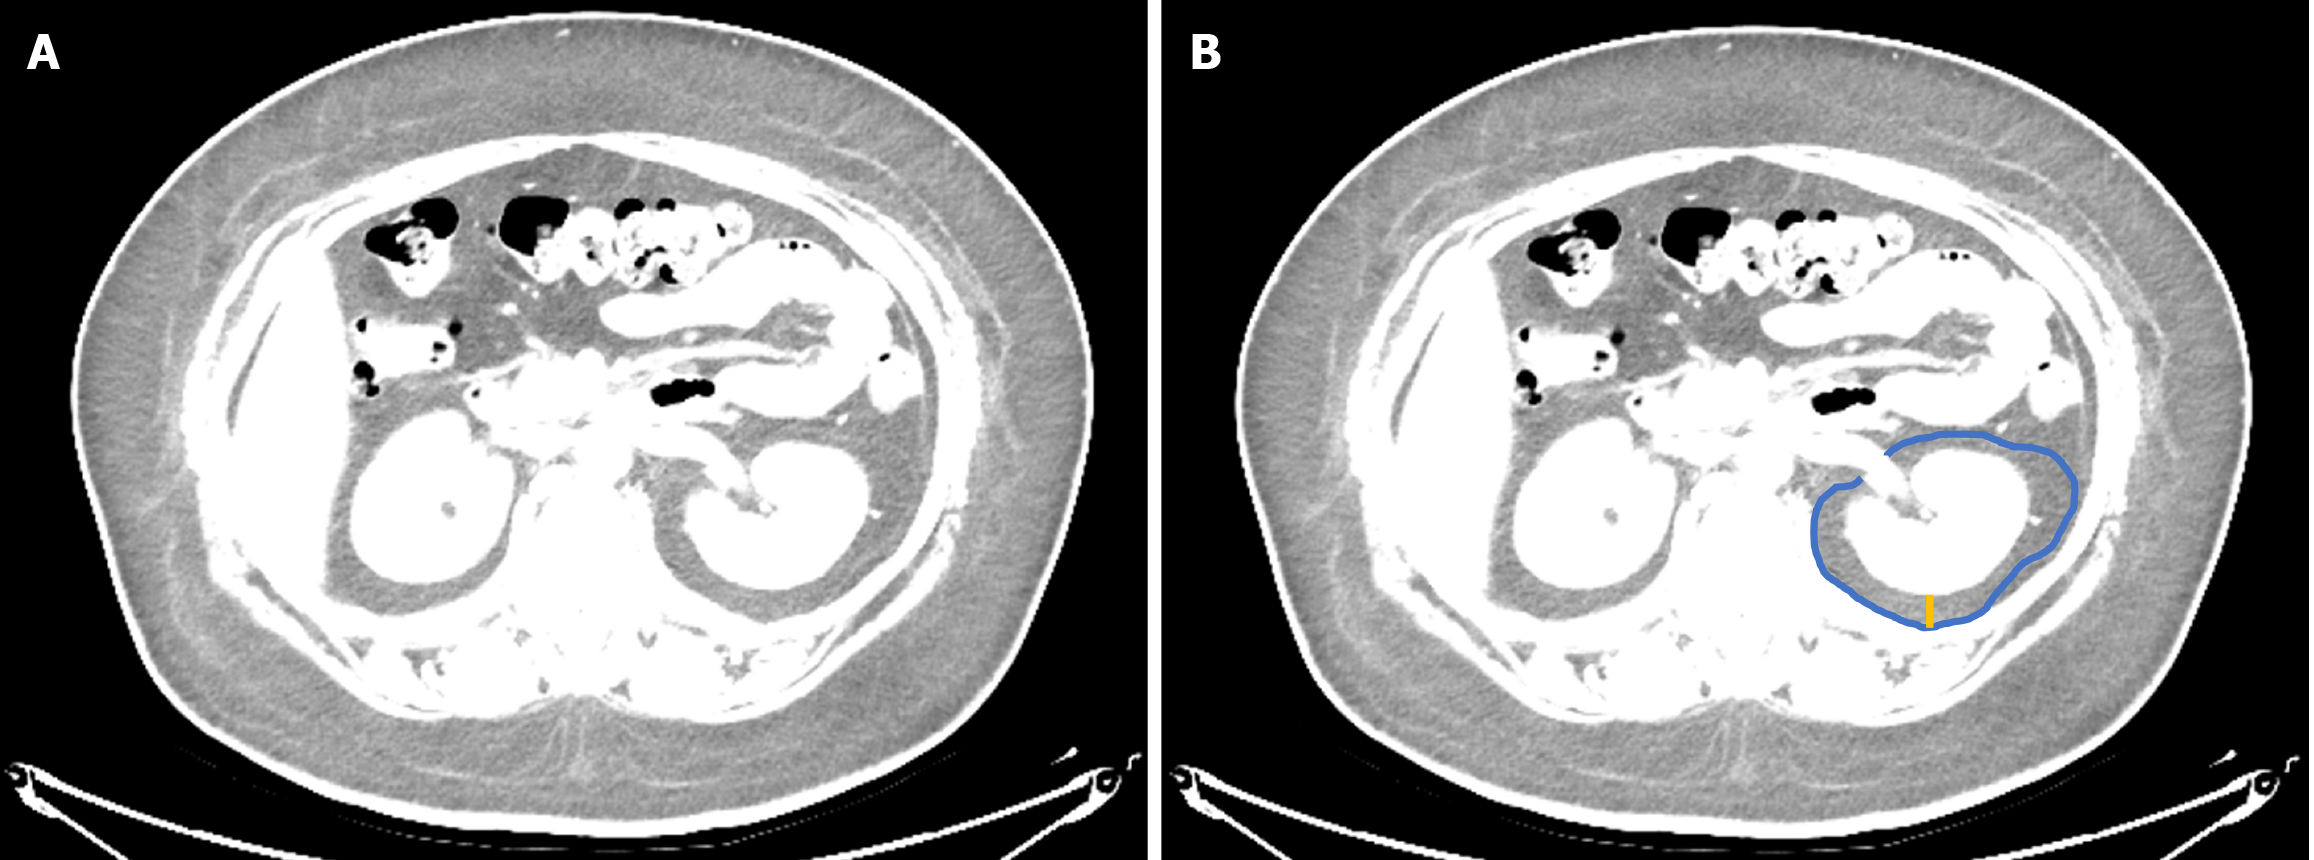
Figure 1 The schematic diagram for measuring the perirenal fat area and perirenal fat thickness.
A: At the level of the left renal vein, the computed tomography window width was adjusted to 150 HU, and the window level was adjusted to -120 HU; B: The blue line represents the boundary line of perirenal fat area, and the yellow line represents the length of perirenal fat thickness.
- Citation: Li Y, Zheng KY, Liu ZL, Yu TM, Zhang WJ, Zhong MW, Hu SY. Perirenal fat area is a preoperative predictor of hypertension resolution after laparoscopic sleeve gastrectomy: Generalized additive models. World J Gastroenterol 2025; 31(12): 104952
- URL: https://www.wjgnet.com/1007-9327/full/v31/i12/104952.htm
- DOI: https://dx.doi.org/10.3748/wjg.v31.i12.104952


