Copyright
©The Author(s) 2025.
World J Gastroenterol. Mar 28, 2025; 31(12): 103094
Published online Mar 28, 2025. doi: 10.3748/wjg.v31.i12.103094
Published online Mar 28, 2025. doi: 10.3748/wjg.v31.i12.103094
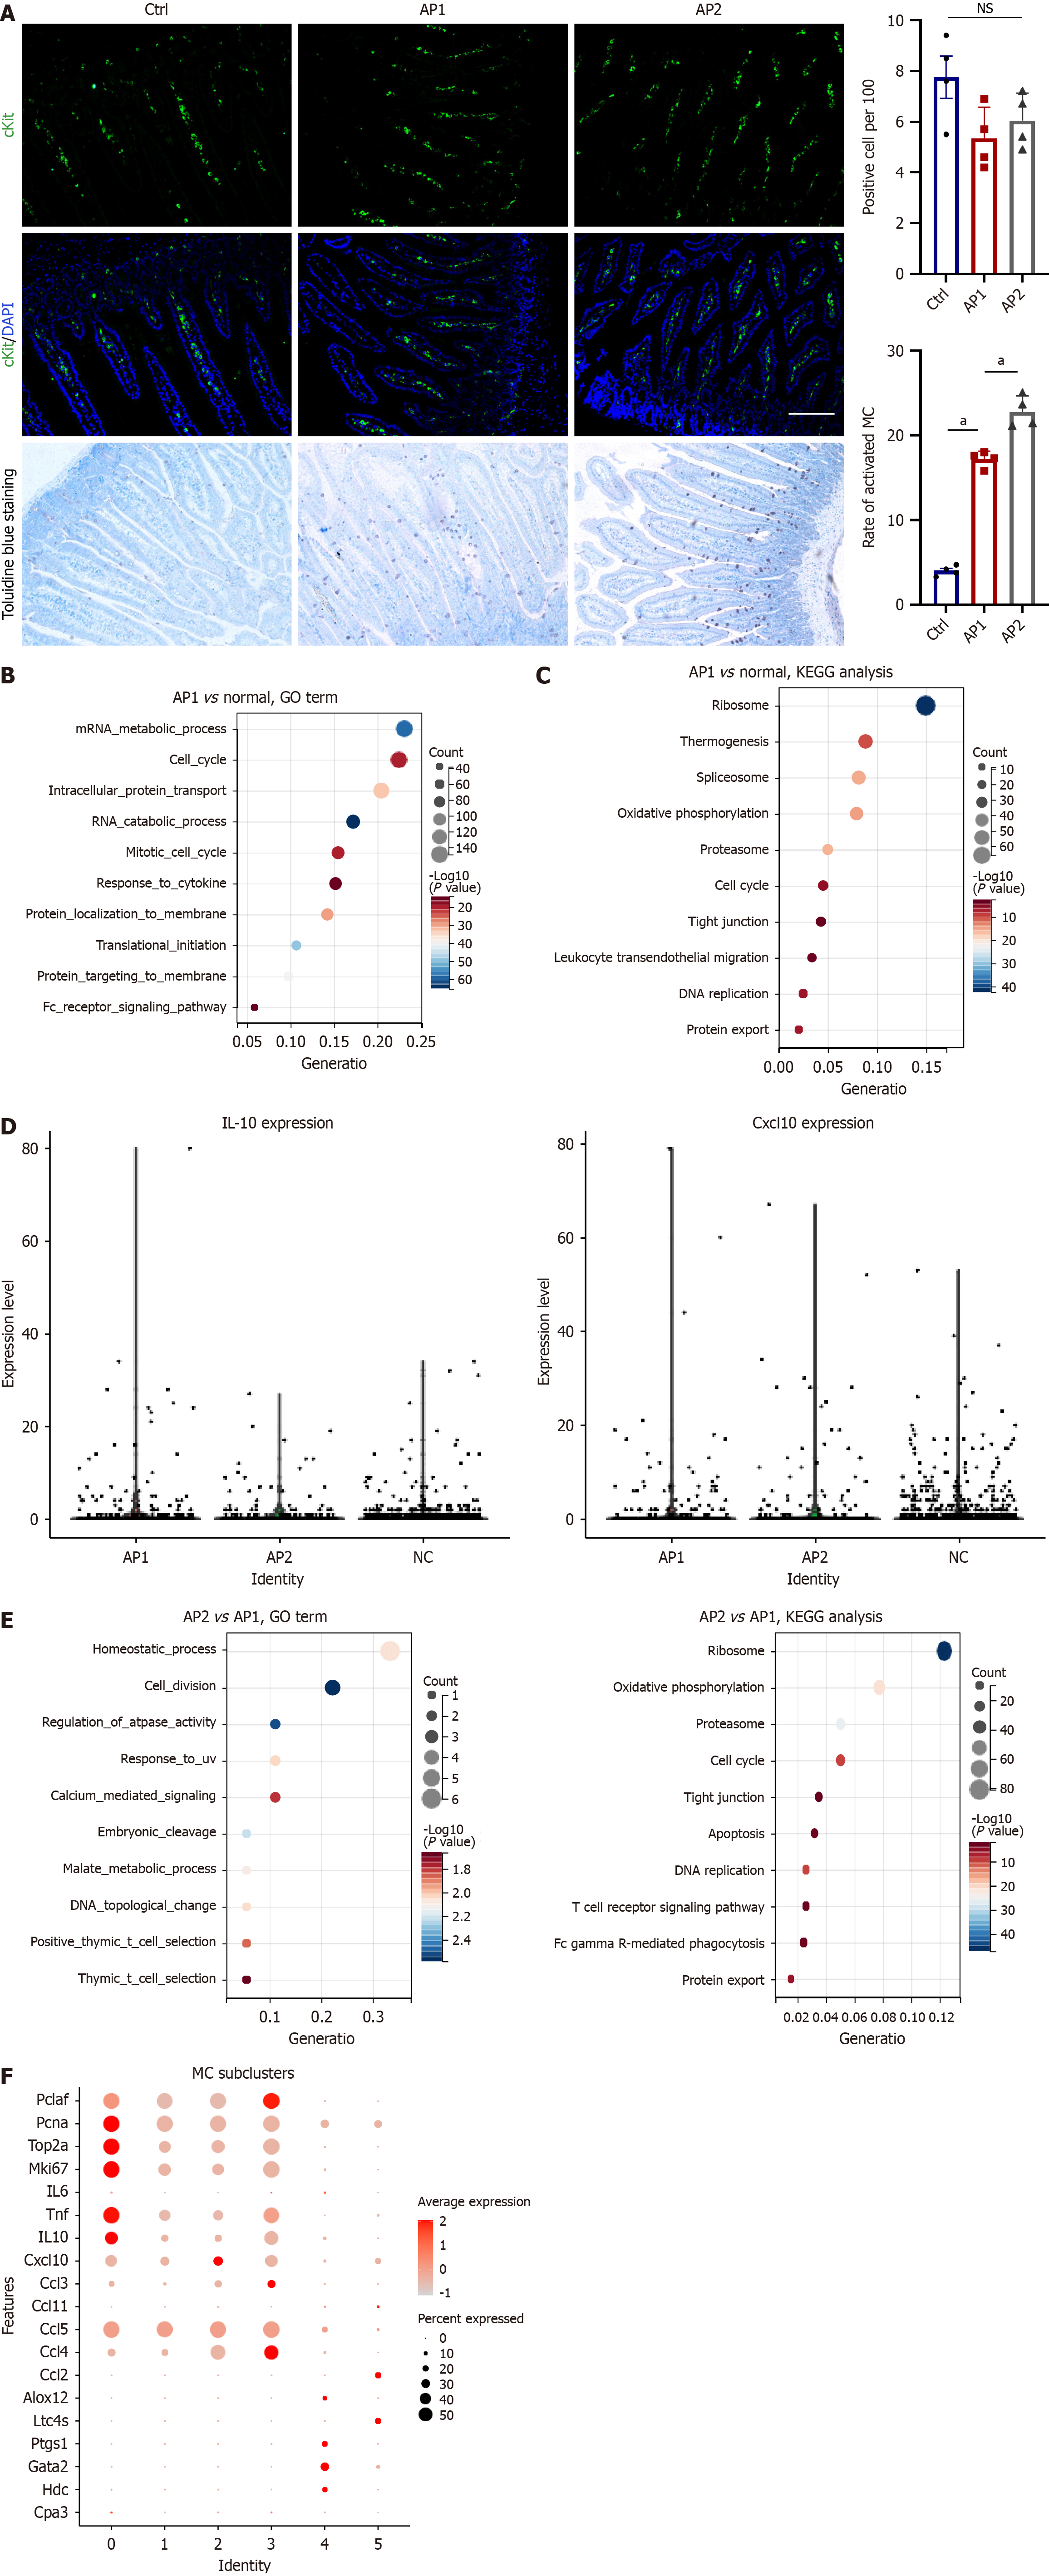
Figure 7 Early activation of mast cells in the intestine of acute pancreatitis.
A: Protein expression of cKit in the small intestine from the AP1, AP2, and normal groups (upper left) and semiquantitative analysis (upper right). Toluidine blue staining of the small intestine (lower left) and semiquantitative analysis of activated mast cells (MCs; lower right); B and C: Representative enriched Gene Ontology (GO) terms and Kyoto Encyclopedia of Genes and Genomes (KEGG) pathways for differentially expressed genes (DEGs) in MCs from the AP1 and normal groups on the basis of scRNA-seq data; D: Violin plots showing the expression of IL-10 and Cxcl10 across each group in the small intestine; E: Representative enriched GO terms and KEGG pathways for DEGs in MCs from the AP2 and AP1 groups on the basis of scRNA-seq data; F: Selected dysregulated genes in MC subclusters, including Pclaf, Pcna, Top2a, Mki67, Il6, Tnf, Il10, Cxcl10, Ccl3, Ccl11, Ccl5, Ccl4, Ccl2, Alox12, Ltc4s, Ptgs1, Gata2, Hdc, and Cpa3. GO: Gene Ontology; KEGG: Kyoto Encyclopedia of Genes and Genomes; MC: Mast cell; NS: No significance. aP < 0.001.
- Citation: Wei ZX, Jiang SH, Qi XY, Cheng YM, Liu Q, Hou XY, He J. scRNA-seq of the intestine reveals the key role of mast cells in early gut dysfunction associated with acute pancreatitis. World J Gastroenterol 2025; 31(12): 103094
- URL: https://www.wjgnet.com/1007-9327/full/v31/i12/103094.htm
- DOI: https://dx.doi.org/10.3748/wjg.v31.i12.103094


