Copyright
©The Author(s) 2025.
World J Gastroenterol. Mar 28, 2025; 31(12): 103094
Published online Mar 28, 2025. doi: 10.3748/wjg.v31.i12.103094
Published online Mar 28, 2025. doi: 10.3748/wjg.v31.i12.103094
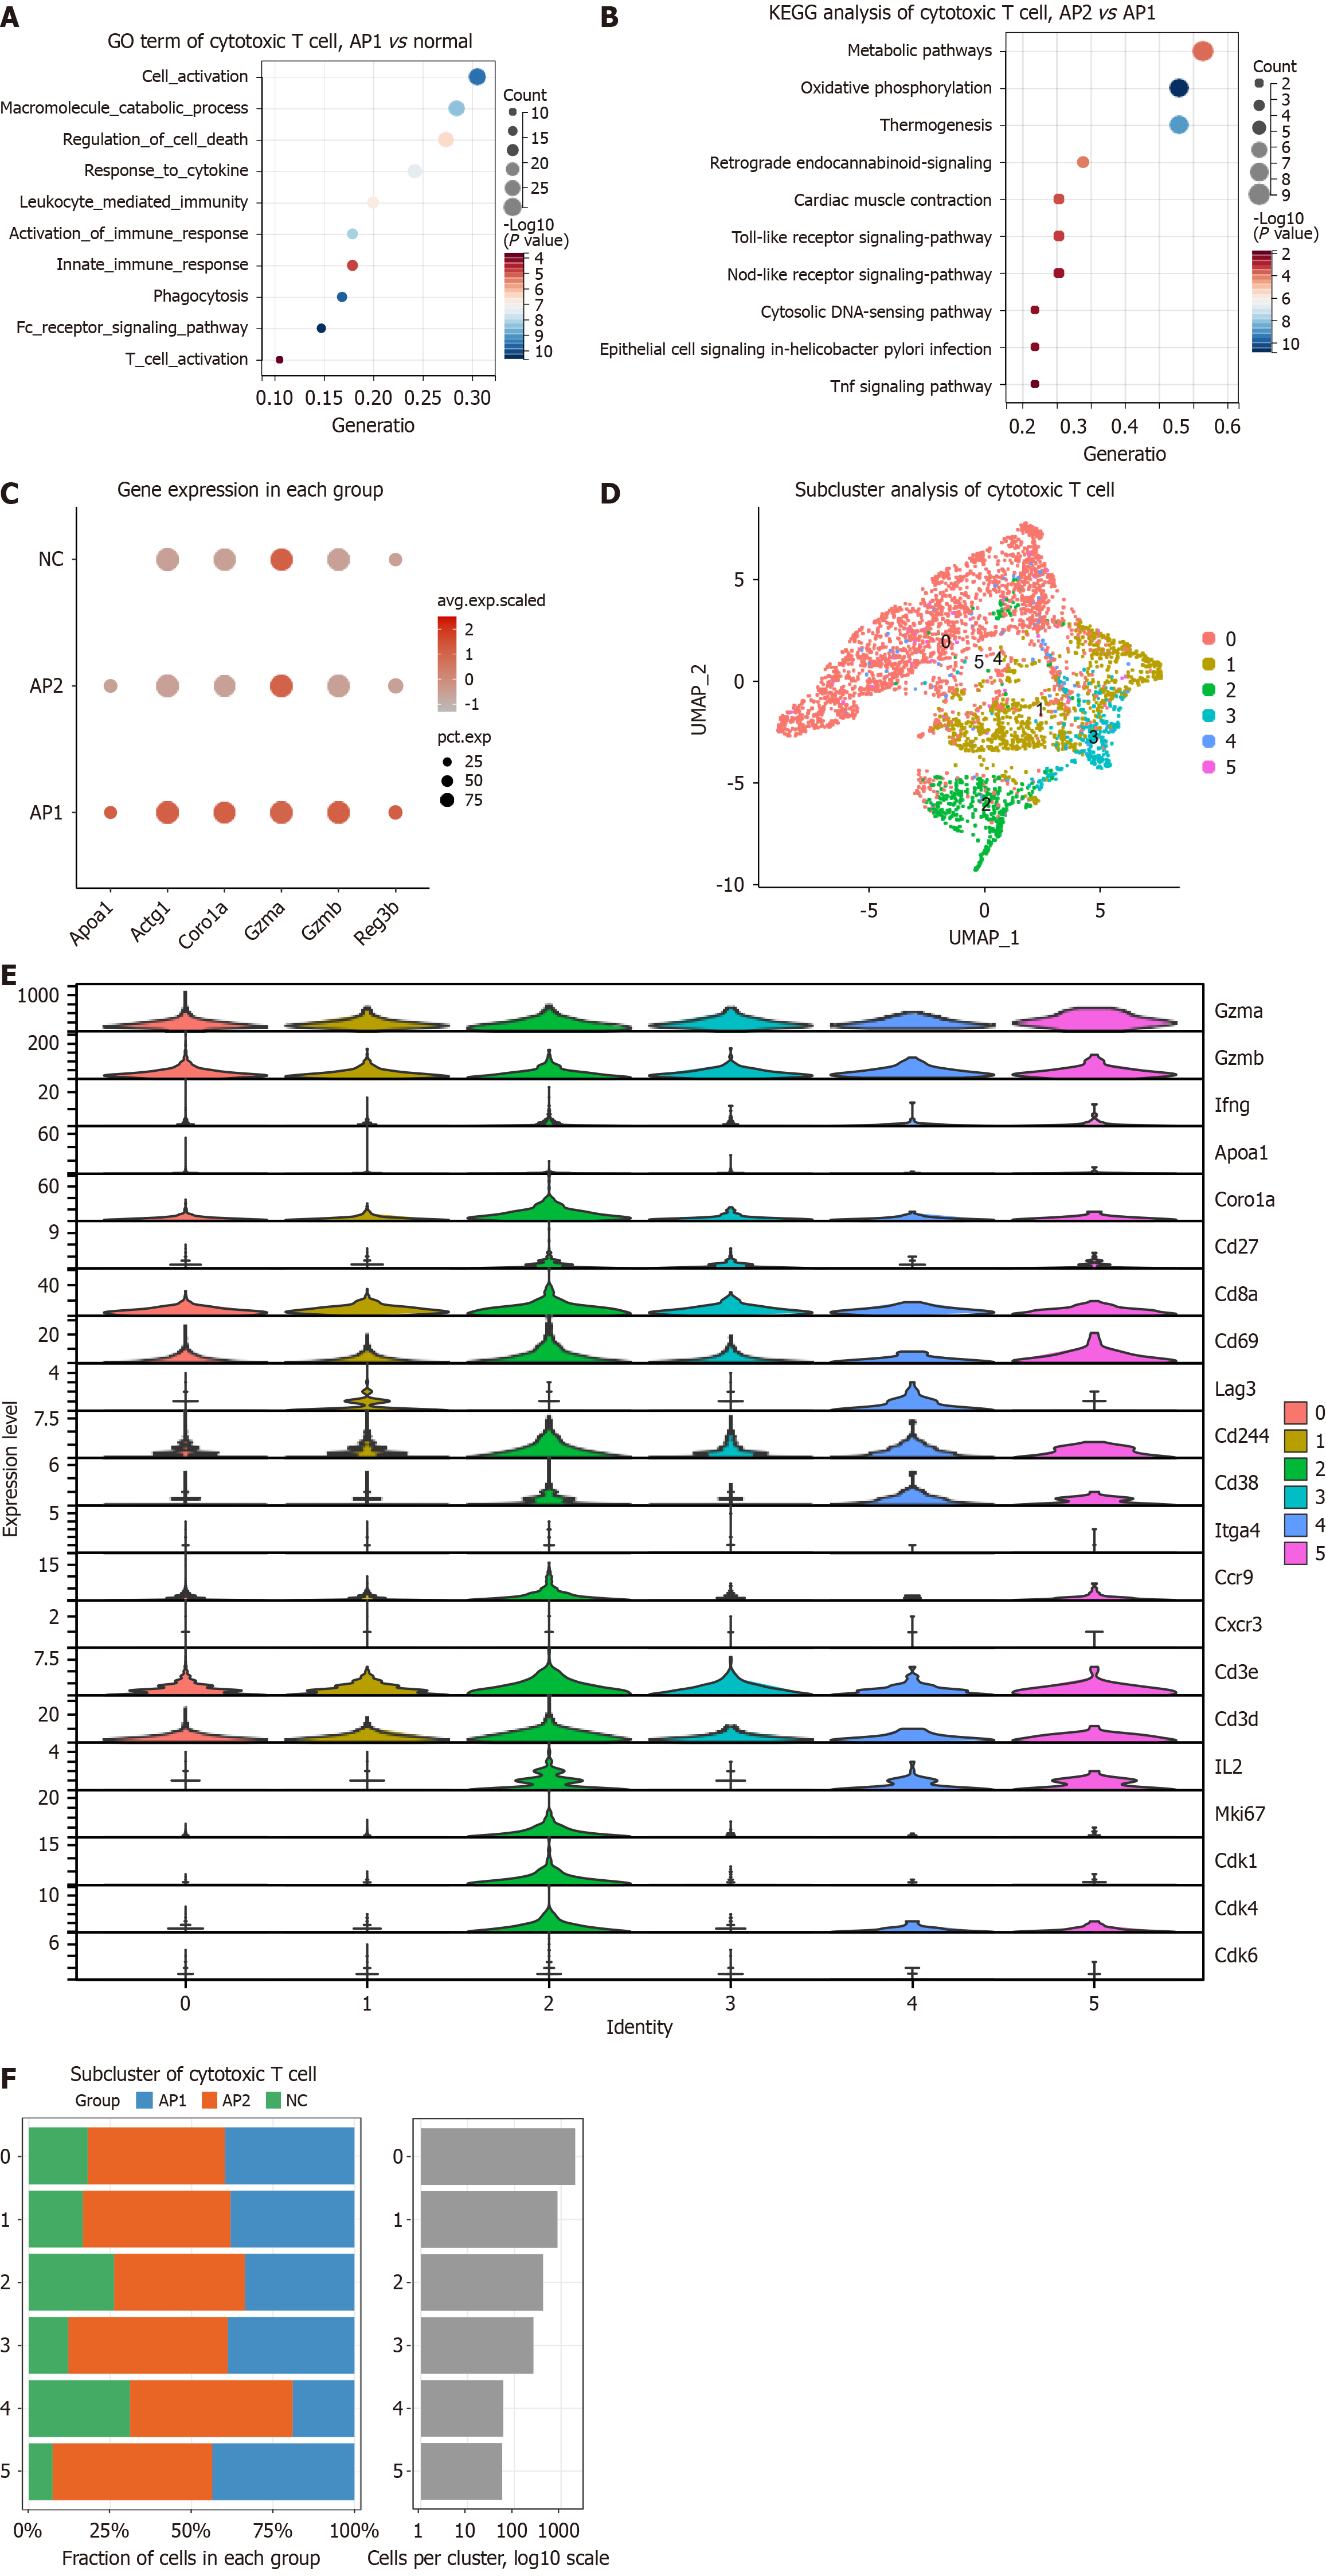
Figure 5 Enhanced antibacterial ability of intestinal cytotoxic T cells in acute pancreatitis.
A: Representative enriched gene ontology terms for differentially expressed genes (DEGs) in cytotoxic T cells from the AP1 and normal groups based on scRNA-seq data; B: Representative enriched Kyoto Encyclopedia of Genes and Genomes pathways for DEGs in cytotoxic T cells from the AP2 and AP1 groups; C: Selected dysregulated genes, including Apoa1, Actg1, Coro1a, Gzma, Gzmb, and Reg3b, in cytotoxic T cells; D: UMAP plot showing 6 cytotoxic T-cell subclusters in the intestine; E: Expression of selected genes in cytotoxic T-cell subclusters, including Gzma, Gzmb, Ifng, Apoa1, Coro1a, Cd27, Cd8a, Cd69, Lag3, Cd244, Cd38, Itga4, Ccr9, Cxcr3, Cd3e, Cd3d, Il2, Mki67, Cdk1, Cdk4, and Cdk6; F: Percentage of cells in each cytotoxic T-cell subcluster. GO: Gene ontology; KEGG: Kyoto Encyclopedia of Genes and Genomes.
- Citation: Wei ZX, Jiang SH, Qi XY, Cheng YM, Liu Q, Hou XY, He J. scRNA-seq of the intestine reveals the key role of mast cells in early gut dysfunction associated with acute pancreatitis. World J Gastroenterol 2025; 31(12): 103094
- URL: https://www.wjgnet.com/1007-9327/full/v31/i12/103094.htm
- DOI: https://dx.doi.org/10.3748/wjg.v31.i12.103094


