Copyright
©The Author(s) 2025.
World J Gastroenterol. Mar 28, 2025; 31(12): 103094
Published online Mar 28, 2025. doi: 10.3748/wjg.v31.i12.103094
Published online Mar 28, 2025. doi: 10.3748/wjg.v31.i12.103094
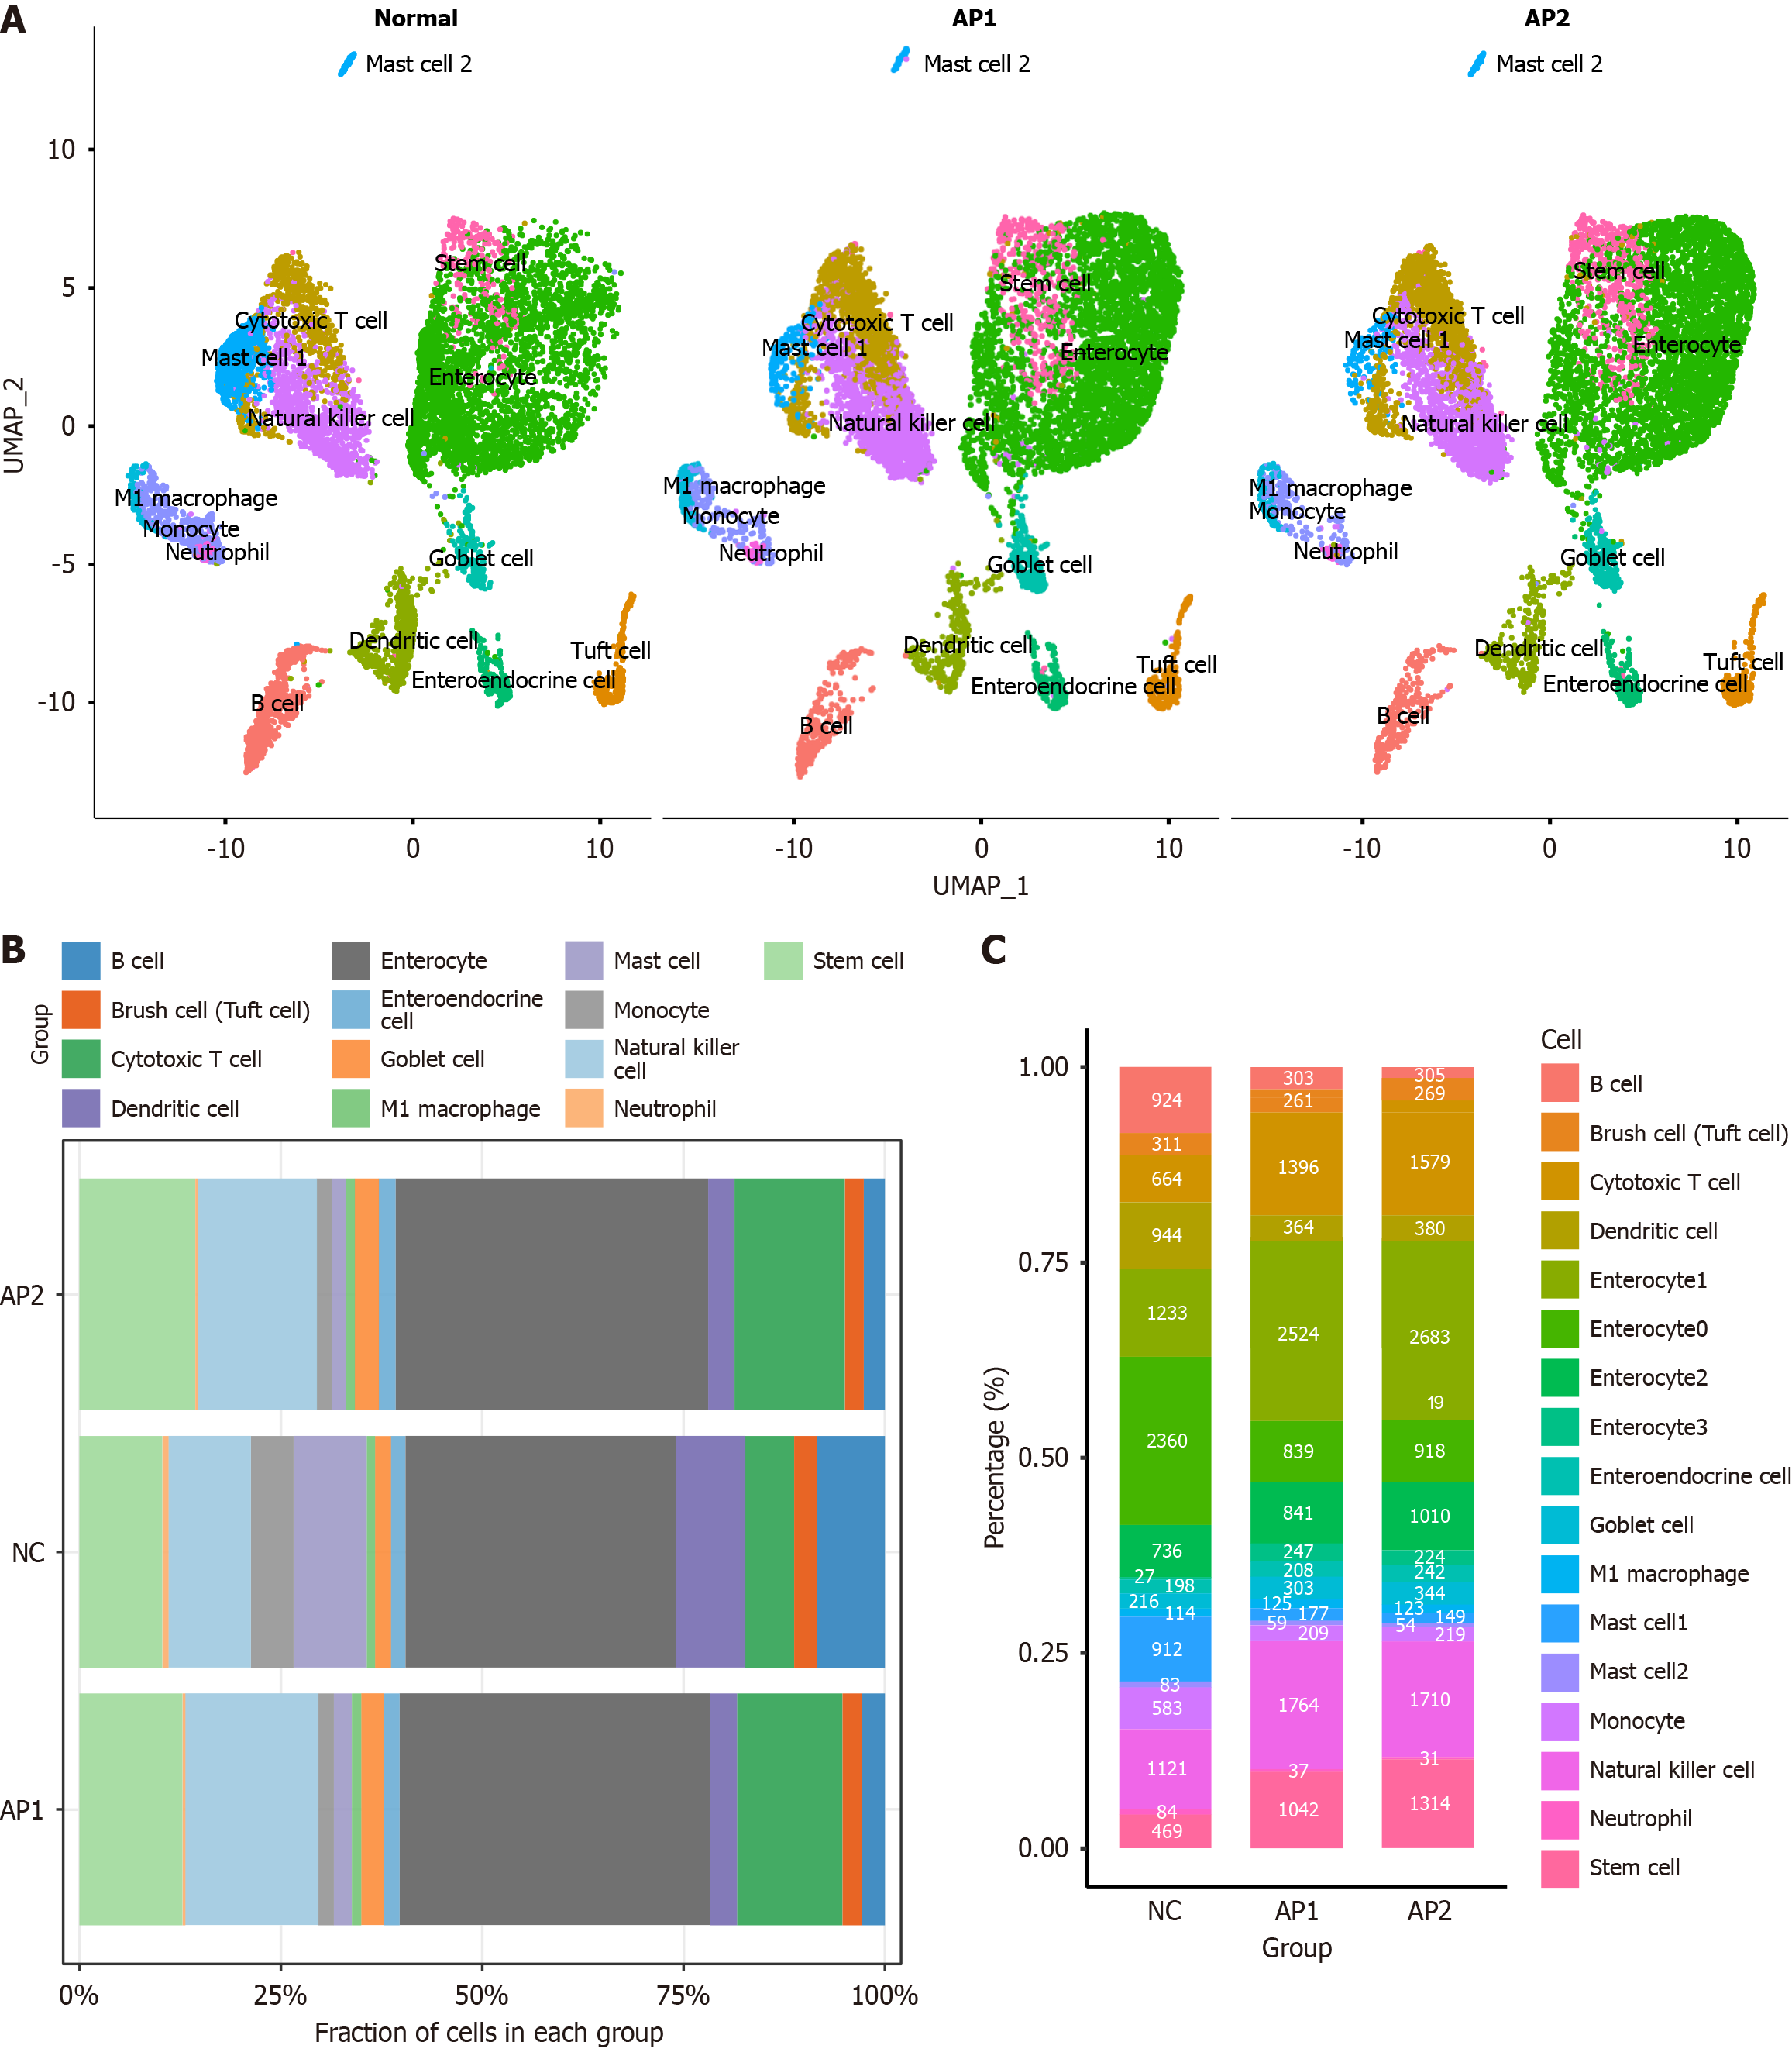
Figure 2 Proportions of these 17 clusters of cells in each group.
A: UMAP plot illustrating major cell types in the small intestine of each group; B: The cell proportions of each cluster in each group; C: The cell count for each cluster in each group.
- Citation: Wei ZX, Jiang SH, Qi XY, Cheng YM, Liu Q, Hou XY, He J. scRNA-seq of the intestine reveals the key role of mast cells in early gut dysfunction associated with acute pancreatitis. World J Gastroenterol 2025; 31(12): 103094
- URL: https://www.wjgnet.com/1007-9327/full/v31/i12/103094.htm
- DOI: https://dx.doi.org/10.3748/wjg.v31.i12.103094


