Copyright
©The Author(s) 2025.
World J Gastroenterol. Mar 21, 2025; 31(11): 104377
Published online Mar 21, 2025. doi: 10.3748/wjg.v31.i11.104377
Published online Mar 21, 2025. doi: 10.3748/wjg.v31.i11.104377
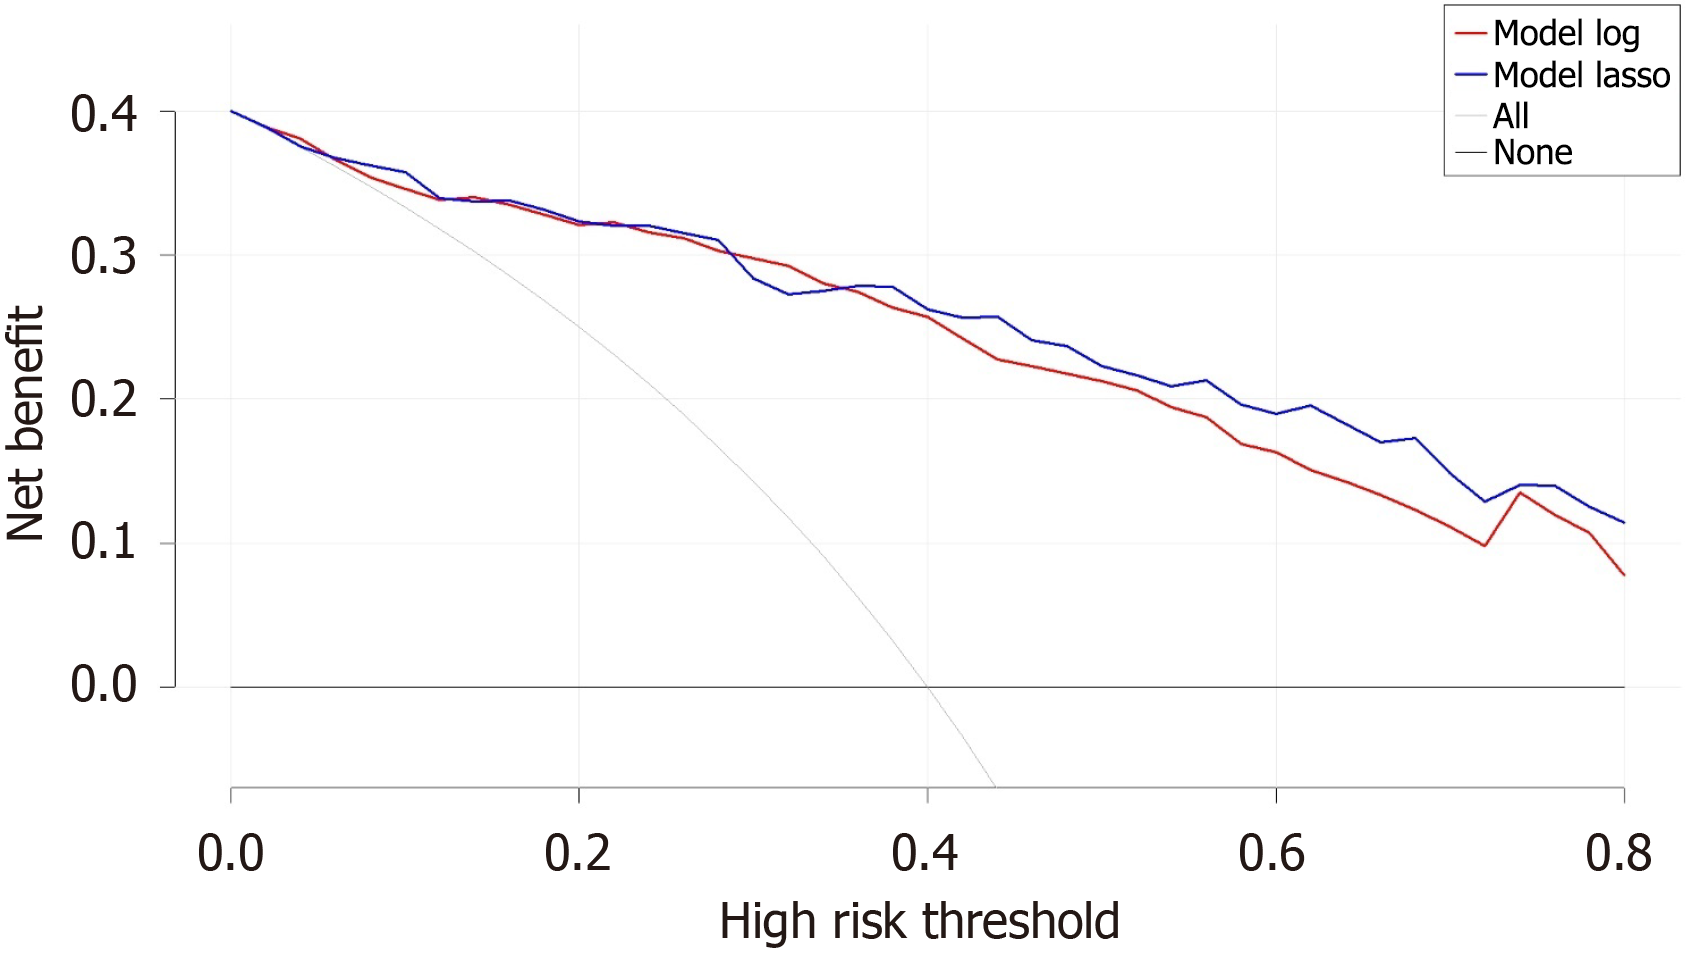
Figure 7 Decision curve analysis on the prediction models.
A high-risk threshold of 0.8 was set, above which clinically recommended endoscopic resection was advised. The gray curve represents the net benefit for all patients receiving endoscopic resection, while the black line indicates the net benefit (NB) when all patients were followed up. The red curve represents the NB based on intervention decisions made using a stepwise regression model, and the blue curve represents the NB based on intervention decisions made using the least absolute shrinkage and selection operator model.
- Citation: Lyu KM, Chen QQ, Xu YF, Yuan YQ, Wang JF, Wan J, Ling-Hu EQ. Development and validation of a predictive model for the pathological upgrading of gastric low-grade intraepithelial neoplasia. World J Gastroenterol 2025; 31(11): 104377
- URL: https://www.wjgnet.com/1007-9327/full/v31/i11/104377.htm
- DOI: https://dx.doi.org/10.3748/wjg.v31.i11.104377


