Copyright
©The Author(s) 2025.
World J Gastroenterol. Mar 21, 2025; 31(11): 100911
Published online Mar 21, 2025. doi: 10.3748/wjg.v31.i11.100911
Published online Mar 21, 2025. doi: 10.3748/wjg.v31.i11.100911
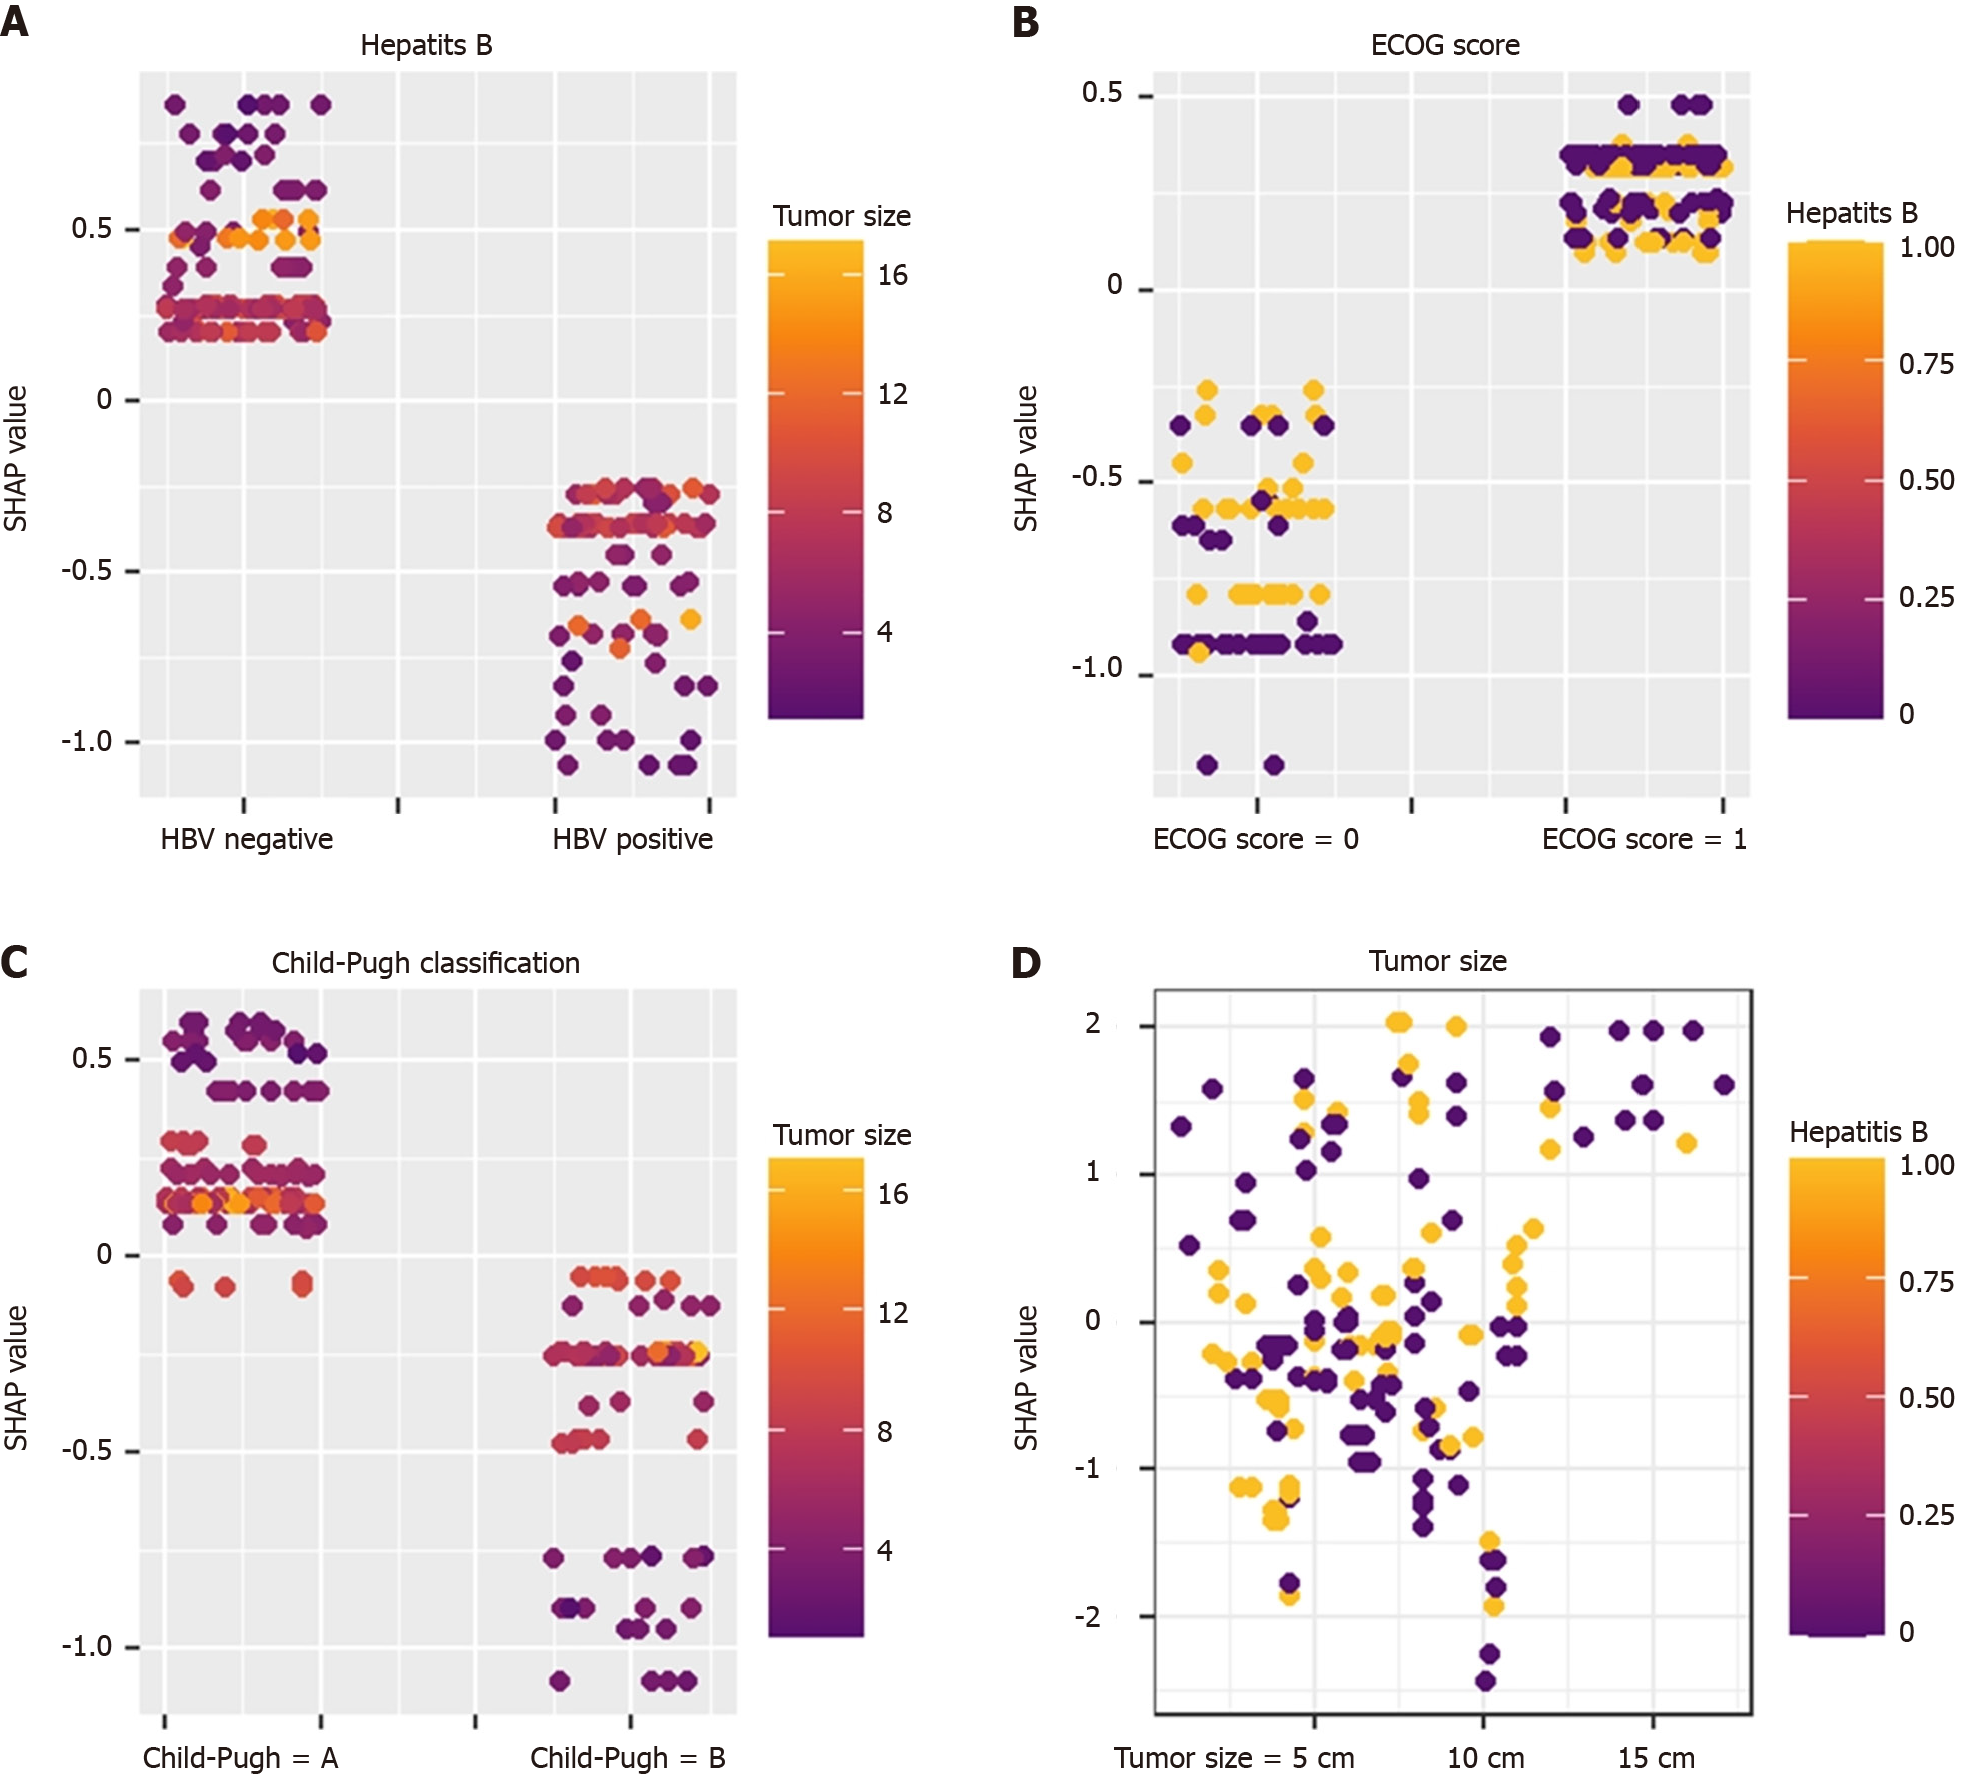
Figure 5 Diagram of variable interaction.
A: Hepatitis B; B: Eastern Cooperative Oncology Group score; C: Child-Pugh classification; D: Tumor size. Different features interact with each other to predict the textbook outcome (TO). For example: In hepatitis B-negative patients, the smaller the tumor, the higher the SHapley Additive exPlanations value, indicating that in hepatitis B-negative patients, the smaller the tumor, the easier it is to achieve the TO. ECOG score: Eastern Cooperative Oncology Group score; SHAP: The SHapley Additive exPlanations.
- Citation: Huang TF, Luo C, Guo LB, Liu HZ, Li JT, Lin QZ, Fan RL, Zhou WP, Li JD, Lin KC, Tang SC, Zeng YY. Preoperative prediction of textbook outcome in intrahepatic cholangiocarcinoma by interpretable machine learning: A multicenter cohort study. World J Gastroenterol 2025; 31(11): 100911
- URL: https://www.wjgnet.com/1007-9327/full/v31/i11/100911.htm
- DOI: https://dx.doi.org/10.3748/wjg.v31.i11.100911


