Copyright
©The Author(s) 2025.
World J Gastroenterol. Mar 21, 2025; 31(11): 100911
Published online Mar 21, 2025. doi: 10.3748/wjg.v31.i11.100911
Published online Mar 21, 2025. doi: 10.3748/wjg.v31.i11.100911
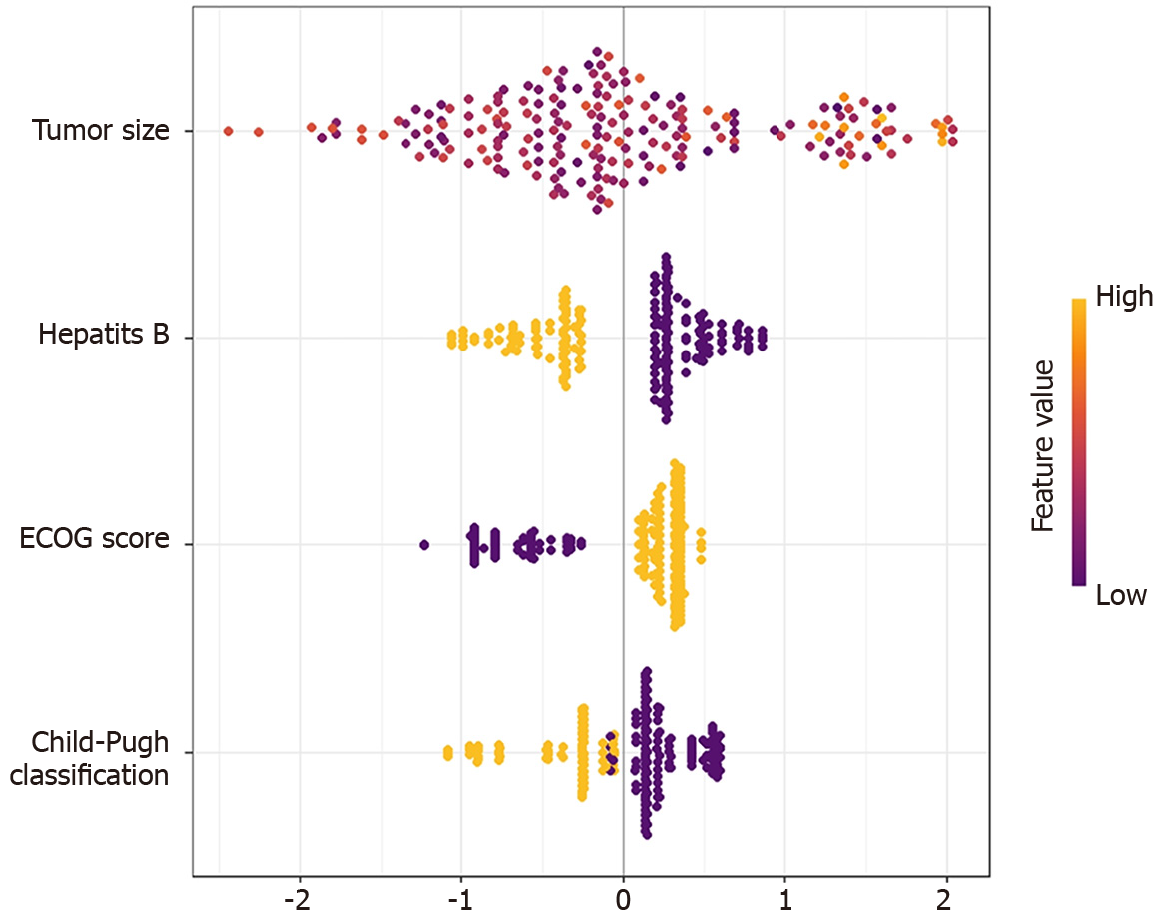
Figure 3 The SHapley Additive exPlanations bee swarm plot.
The color of the point represents the original value of the feature. Red represents high values and blue represents low values. The results show that tumor size has the most important impact on model prediction. ECOG score: Eastern Cooperative Oncology Group score.
- Citation: Huang TF, Luo C, Guo LB, Liu HZ, Li JT, Lin QZ, Fan RL, Zhou WP, Li JD, Lin KC, Tang SC, Zeng YY. Preoperative prediction of textbook outcome in intrahepatic cholangiocarcinoma by interpretable machine learning: A multicenter cohort study. World J Gastroenterol 2025; 31(11): 100911
- URL: https://www.wjgnet.com/1007-9327/full/v31/i11/100911.htm
- DOI: https://dx.doi.org/10.3748/wjg.v31.i11.100911


