Copyright
©The Author(s) 2025.
World J Gastroenterol. Mar 21, 2025; 31(11): 100785
Published online Mar 21, 2025. doi: 10.3748/wjg.v31.i11.100785
Published online Mar 21, 2025. doi: 10.3748/wjg.v31.i11.100785
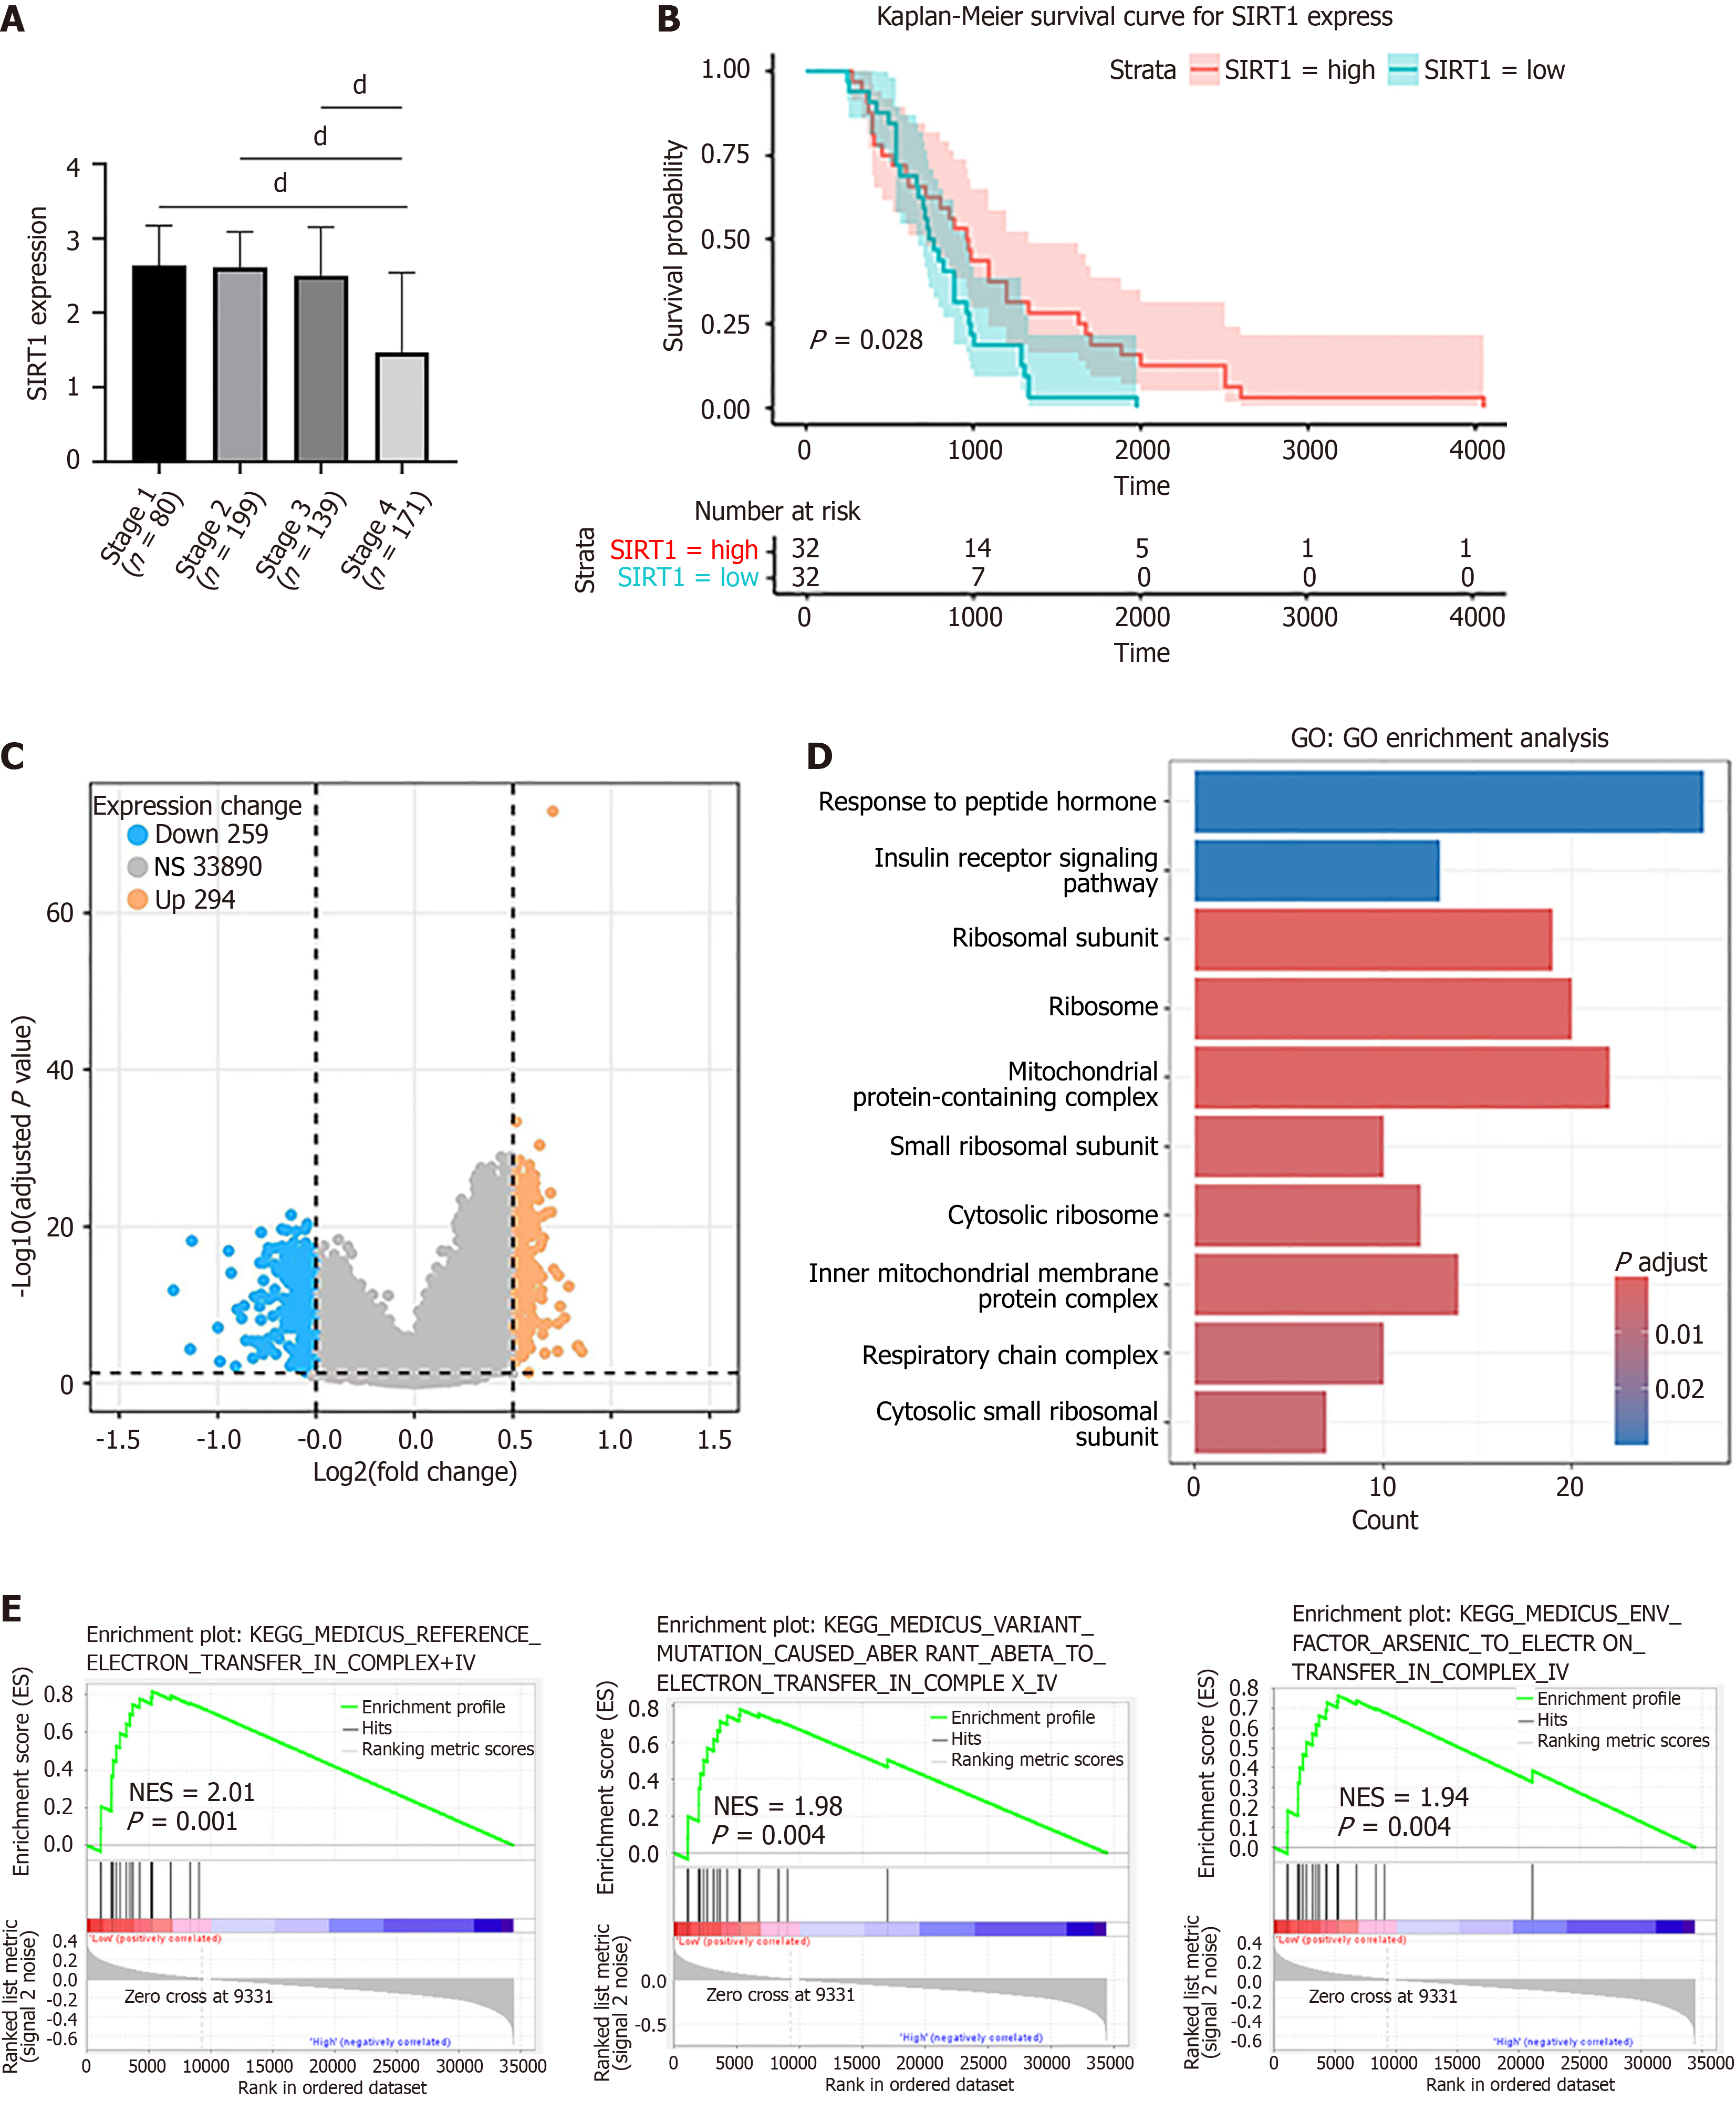
Figure 7 Integrated analysis expression, prognostic value and associated molecular pathways of SIRT1 in colorectal cancer.
A: Relationships between SIRT1 mRNA levels and individual cancer stages of colorectal cancer (CRC). dP < 0.0001; B: Relationships between SIRT1 mRNA levels and overall survival of CRC patients undergoing adjuvant chemotherapy were conducted using Kaplan-Meier analysis; C: Volcano plot of differentially expressed genes in CRC patients with high and low SIRT1 mRNA expression. Yellow dots represent upregulated genes; blue dots represent downregulated genes; gray dots represent non-significant genes; D: Gene Ontology functional enrichment analysis of differentially expressed genes; E: Gene Set Enrichment analysis in the low SIRT1 mRNA expression group. NES: Normalized enrichment scores.
- Citation: Niu YR, Xiang MD, Yang WW, Fang YT, Qian HL, Sun YK. NAD+/SIRT1 pathway regulates glycolysis to promote oxaliplatin resistance in colorectal cancer. World J Gastroenterol 2025; 31(11): 100785
- URL: https://www.wjgnet.com/1007-9327/full/v31/i11/100785.htm
- DOI: https://dx.doi.org/10.3748/wjg.v31.i11.100785


