Copyright
©The Author(s) 2025.
World J Gastroenterol. Mar 21, 2025; 31(11): 100785
Published online Mar 21, 2025. doi: 10.3748/wjg.v31.i11.100785
Published online Mar 21, 2025. doi: 10.3748/wjg.v31.i11.100785
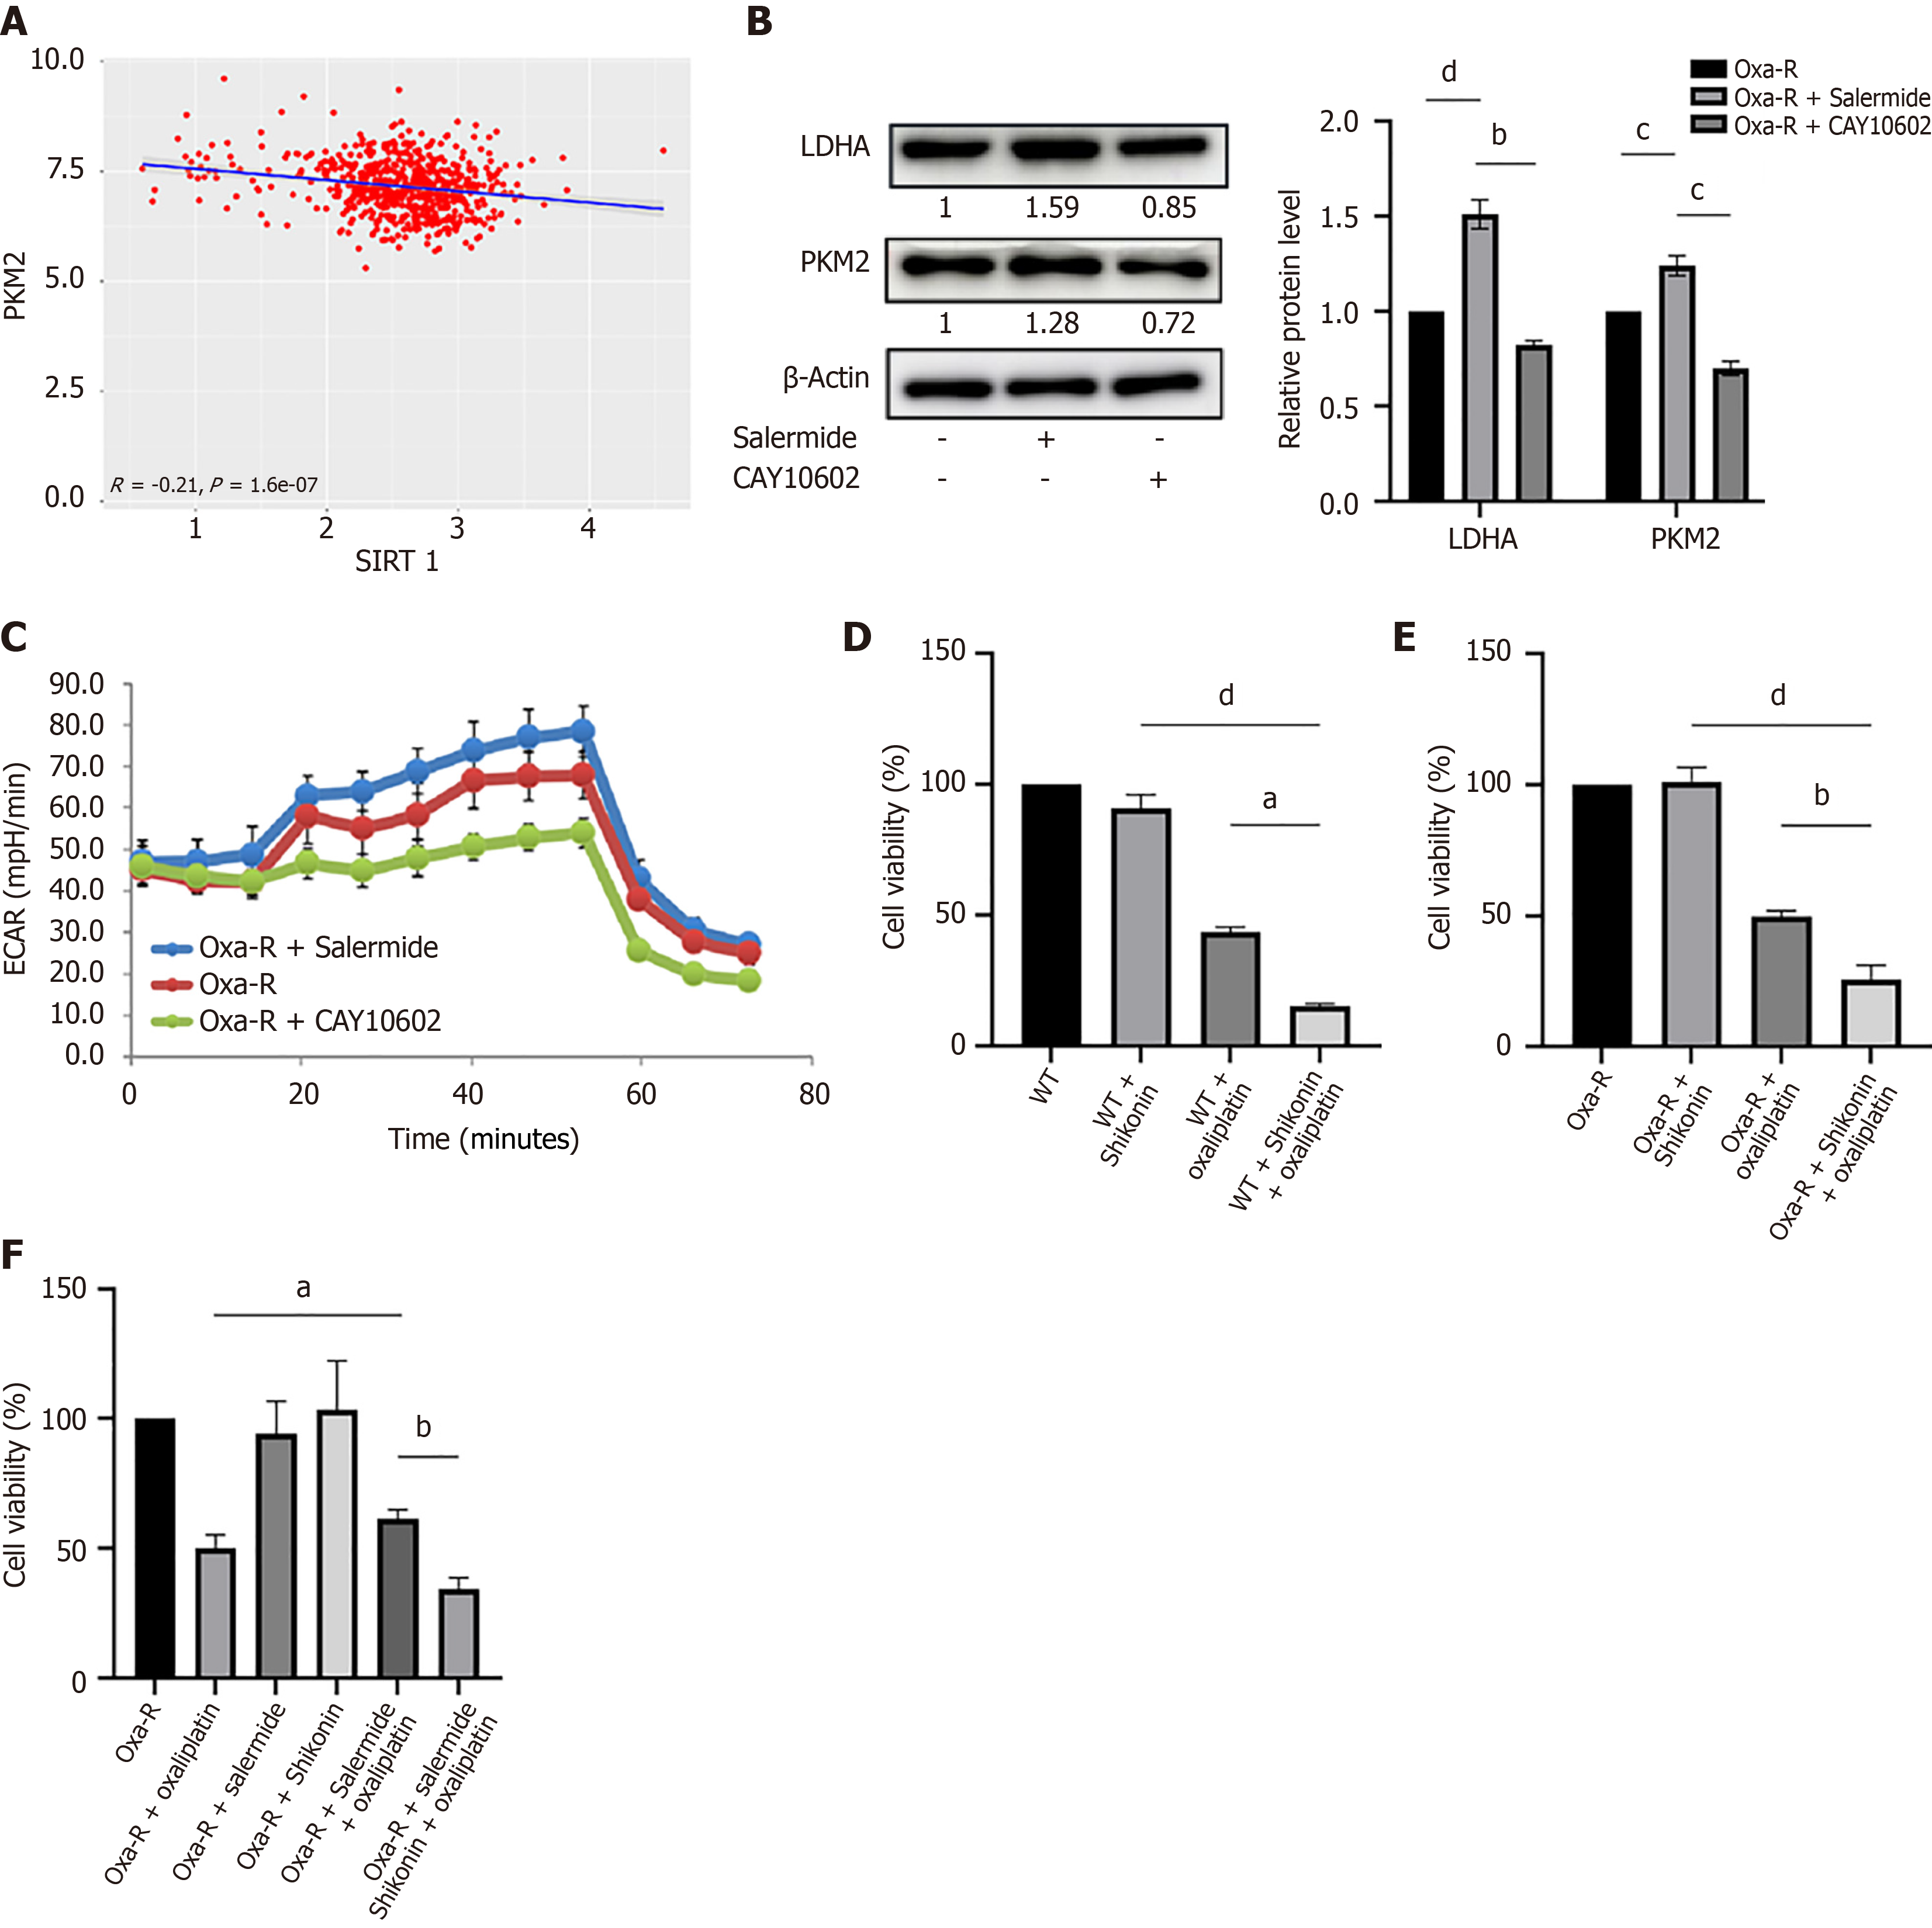
Figure 6 SIRT1 influences oxaliplatin resistance in colorectal cancer cells by regulating glycolysis.
A: Analysis of the Cancer Genome Atlas data shows the correlation between SIRT1 and PKM2 expression in colorectal cancer; B: Western blot analysis revealed the expression of LDHA and PKM2 in HCT116 Oxa-R cells after treatment with salermide (10 μM) or CAY10602 (20 μM) for 12 hours. Each bar represents means ± SD of three separate experiments. bP < 0.01; cP < 0.001; dP < 0.0001. β-Actin served as the internal reference; C: Measurement of the extracellular acidification rate in HCT116 Oxa-R cells with increased or inhibited SIRT1 expression; D: MTS results after 24 hours of treatment of HCT116-WT cells with oxaliplatin (40 μM) alone, shikonin (1 μM) alone, or oxaliplatin combined with shikonin. aP < 0.05; dP < 0.0001; E: MTS results after 24 hours of treatment of HCT116 Oxa-R cells with oxaliplatin (40 μM) alone, shikonin (1 μM) alone, or oxaliplatin combined with shikonin. bP < 0.01; dP < 0.0001; F: A rescue experiment using the MTS assay was performed to evaluate the effect of glycolysis inhibition on the enhanced resistance to oxaliplatin caused by low SIRT1 expression. The Oxa-R cells were treated with oxaliplatin (40 μM) alone, shikonin (1 μM) alone, salermide (10 μM) alone, oxaliplatin (40 μM) combined with salermide (10 μM), or oxaliplatin (40 μM) combined with salermide (10 μM) and shikonin (1 μM) for 24 hours. aP < 0.05; bP < 0.01.
- Citation: Niu YR, Xiang MD, Yang WW, Fang YT, Qian HL, Sun YK. NAD+/SIRT1 pathway regulates glycolysis to promote oxaliplatin resistance in colorectal cancer. World J Gastroenterol 2025; 31(11): 100785
- URL: https://www.wjgnet.com/1007-9327/full/v31/i11/100785.htm
- DOI: https://dx.doi.org/10.3748/wjg.v31.i11.100785


