Copyright
©The Author(s) 2025.
World J Gastroenterol. Mar 21, 2025; 31(11): 100785
Published online Mar 21, 2025. doi: 10.3748/wjg.v31.i11.100785
Published online Mar 21, 2025. doi: 10.3748/wjg.v31.i11.100785
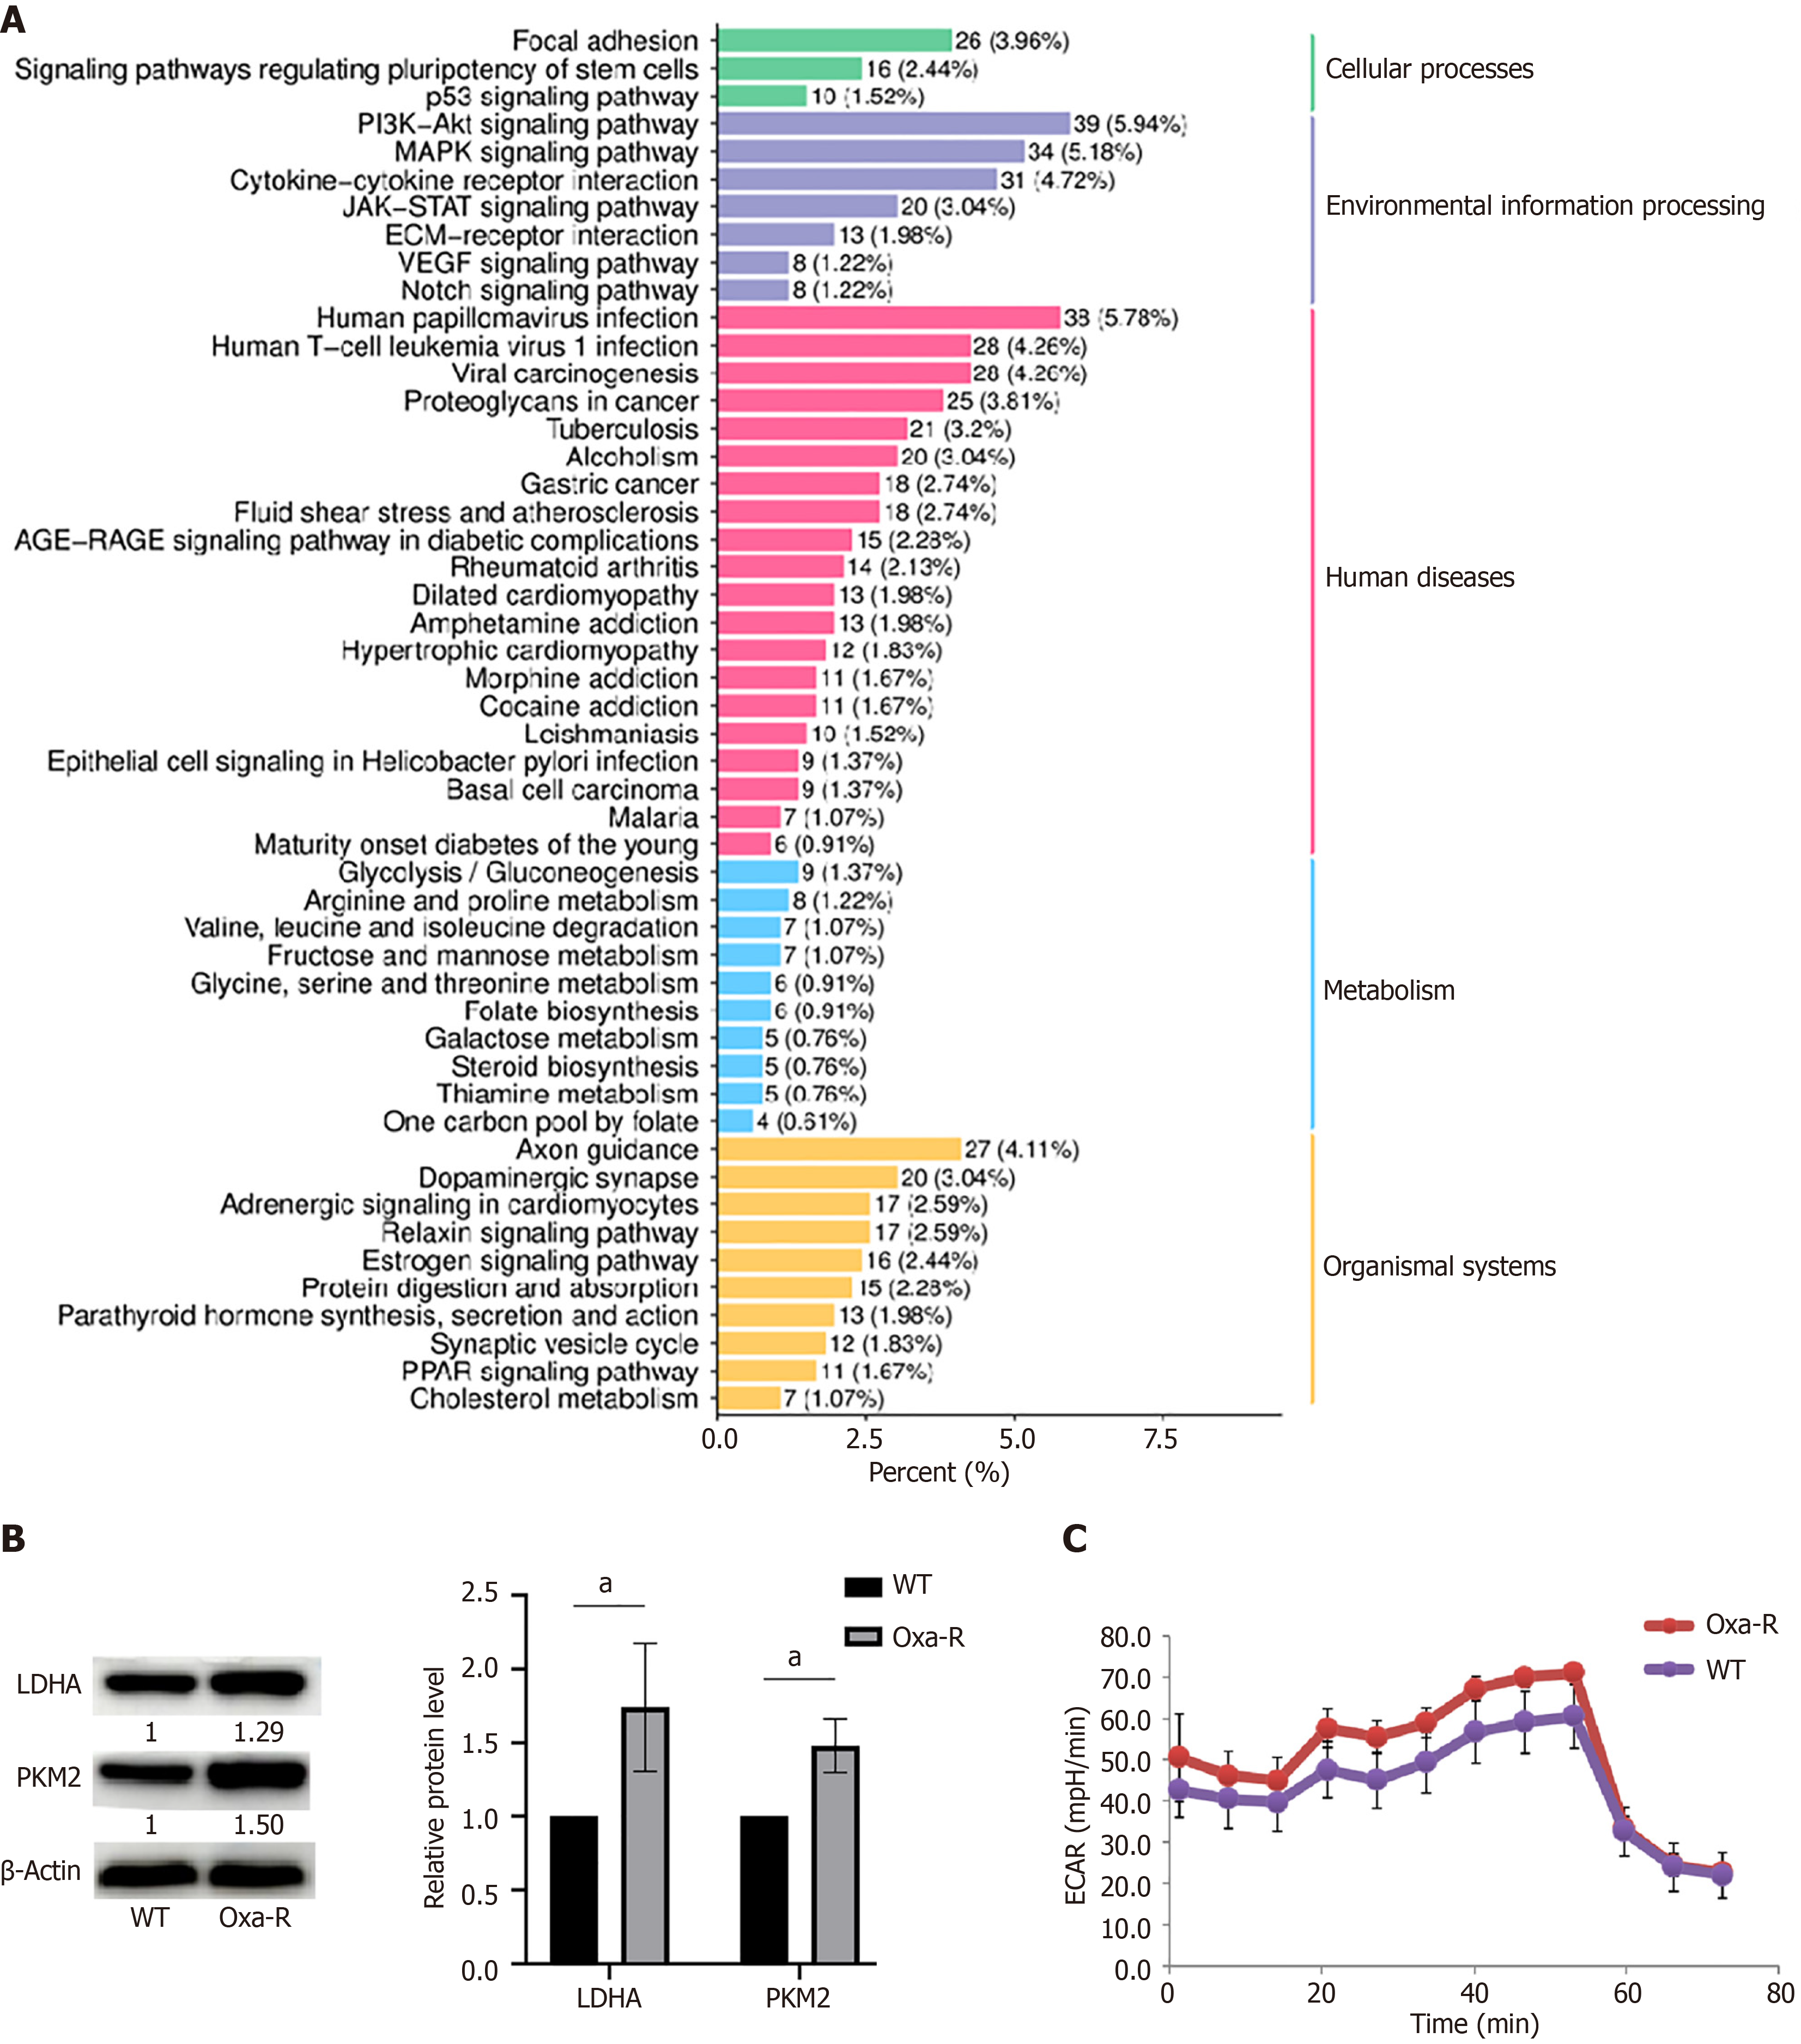
Figure 5 Increased glycolysis in Oxa-R colorectal cancer cells.
A: Enrichment analyses of the Kyoto Encyclopedia of Genes and Genomes pathways associated with resistance-related differentially expressed genes; B: Western blots to determine expression of the key glycolytic enzymes LDHA and PKM2 in HCT116-WT and HCT116 Oxa-R cells. Each bar represents means ± SD of three separate experiments. aP < 0.05. β-Actin was used as the internal reference; C: HCT116-WT and HCT116 Oxa-R cells were seeded in 96-well Seahorse assay plates, and glucose (100 mmol/L), oligomycin (10 μM) and 2-DG (500 mmol/L) were successively added to measure the extracellular acidification rate.
- Citation: Niu YR, Xiang MD, Yang WW, Fang YT, Qian HL, Sun YK. NAD+/SIRT1 pathway regulates glycolysis to promote oxaliplatin resistance in colorectal cancer. World J Gastroenterol 2025; 31(11): 100785
- URL: https://www.wjgnet.com/1007-9327/full/v31/i11/100785.htm
- DOI: https://dx.doi.org/10.3748/wjg.v31.i11.100785


