Copyright
©The Author(s) 2025.
World J Gastroenterol. Mar 14, 2025; 31(10): 101014
Published online Mar 14, 2025. doi: 10.3748/wjg.v31.i10.101014
Published online Mar 14, 2025. doi: 10.3748/wjg.v31.i10.101014
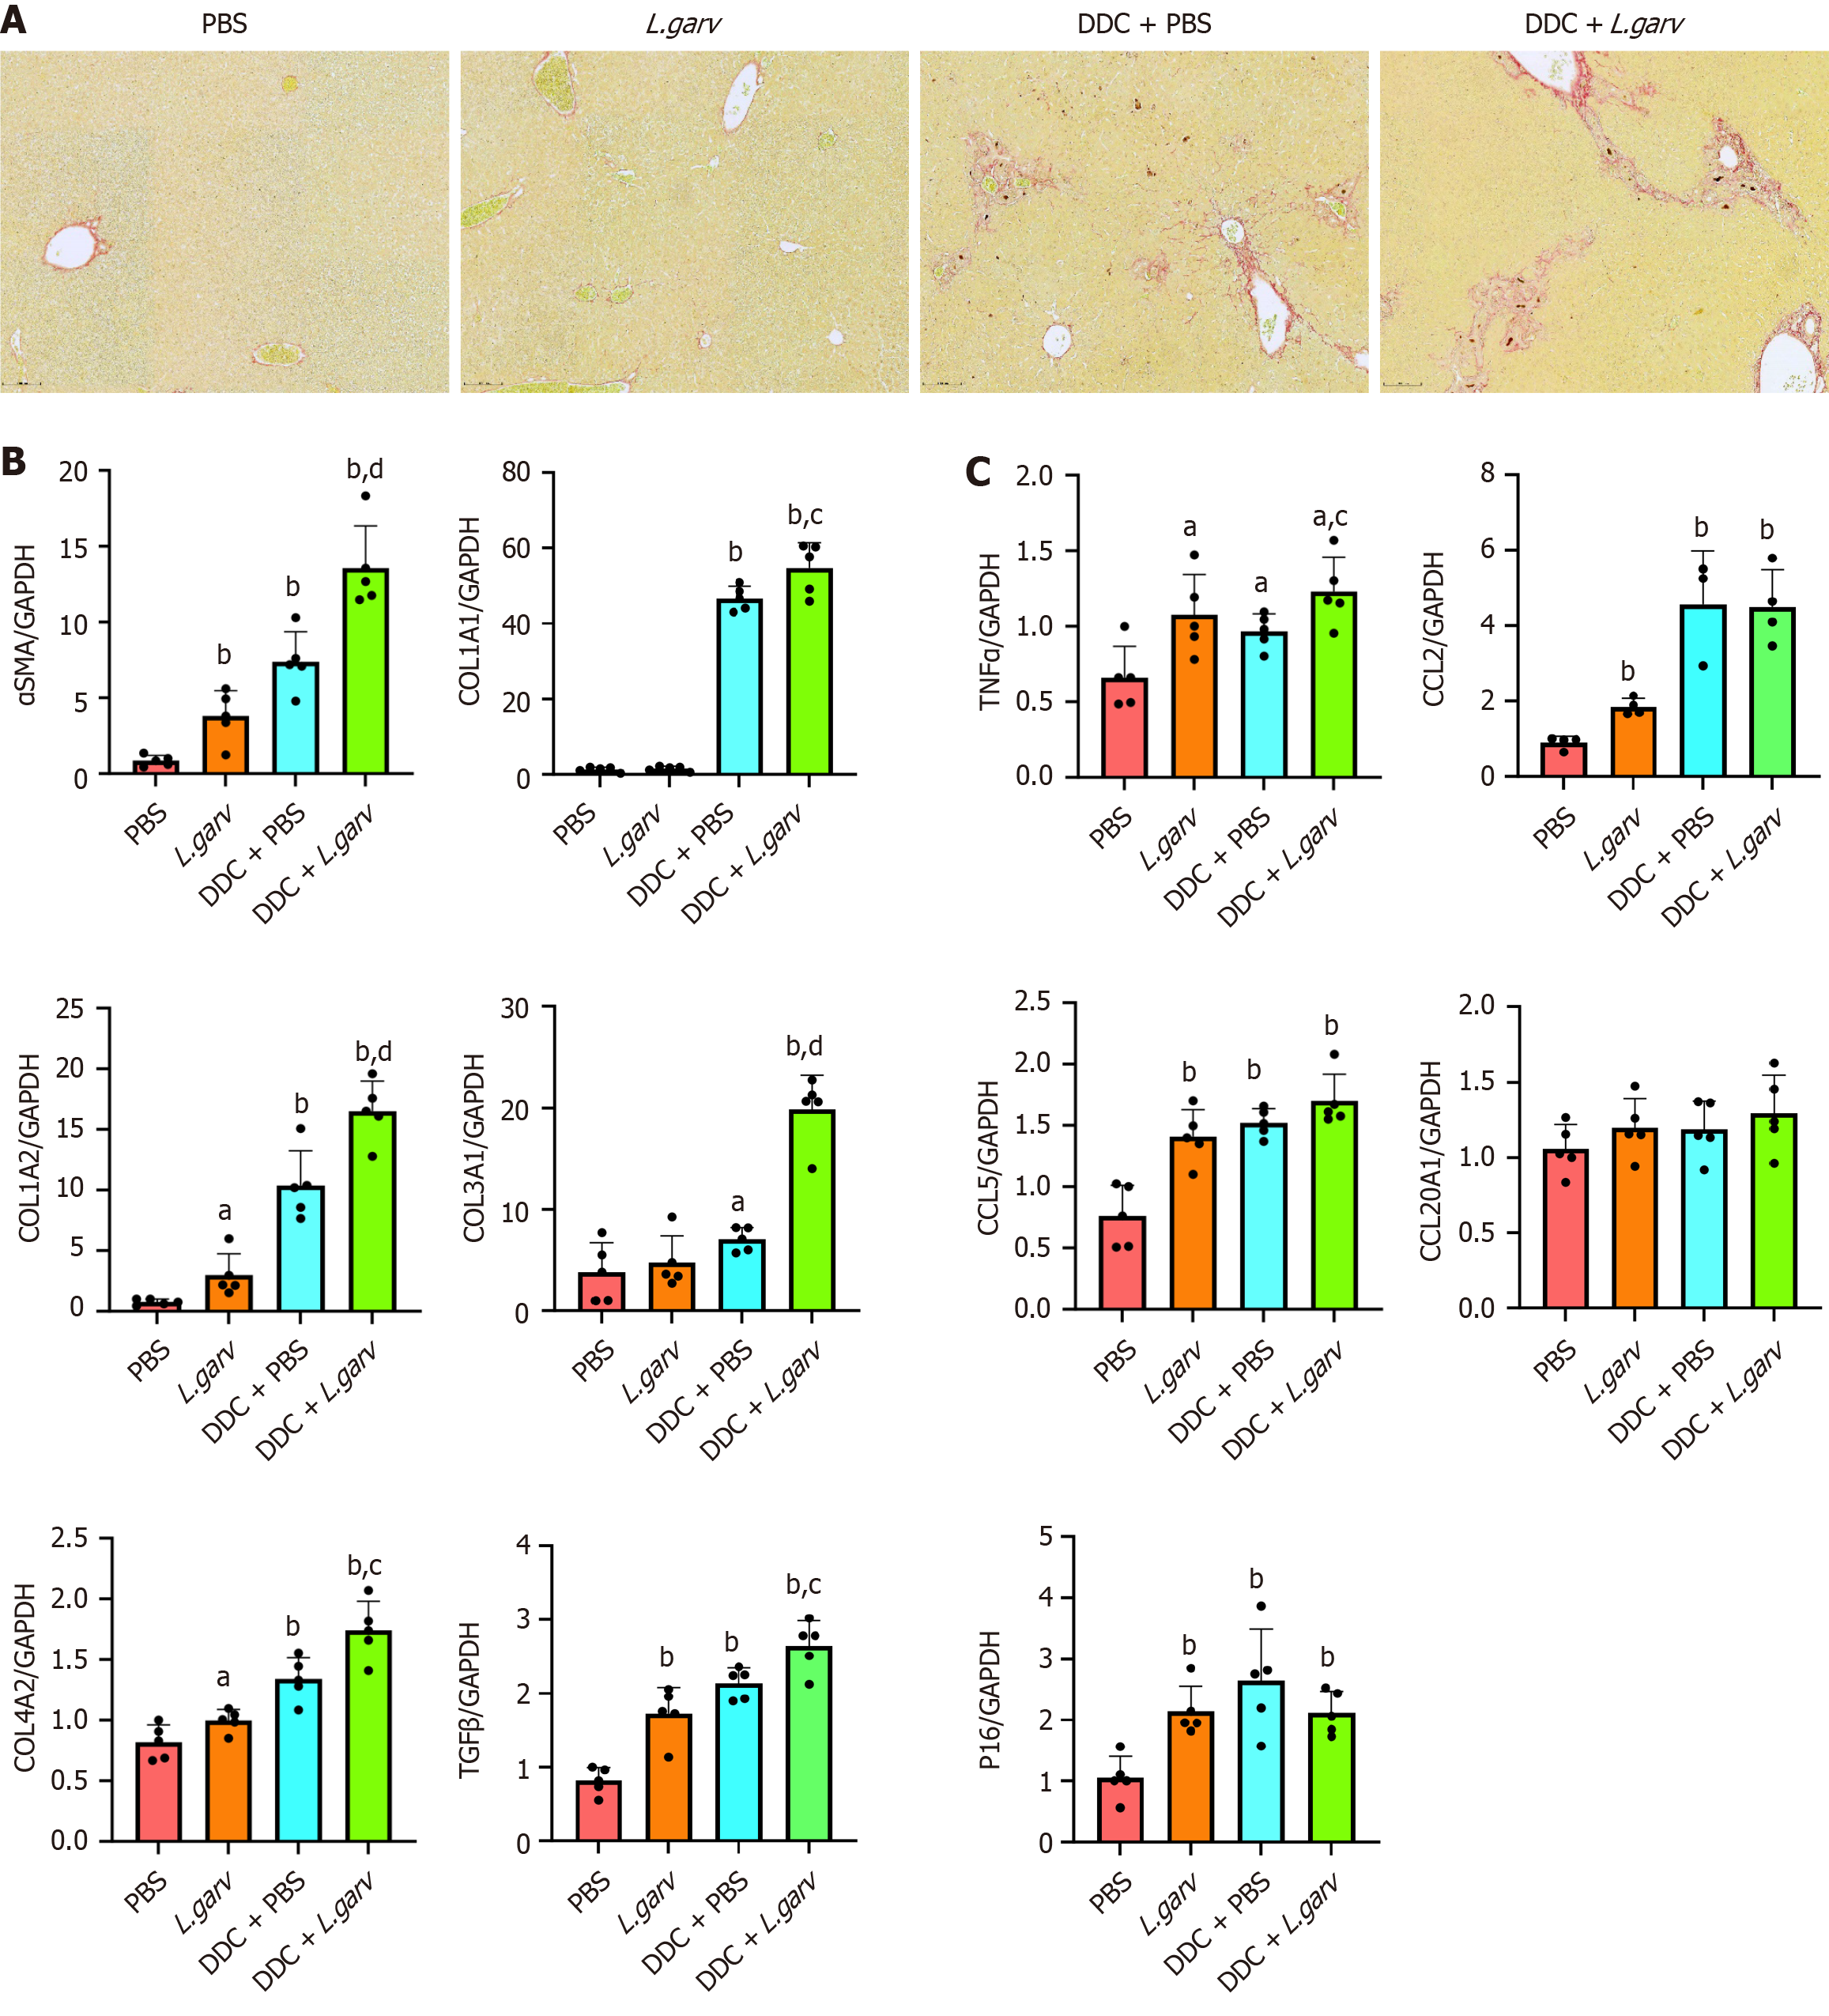
Figure 4 Lactococcus garvieae aggravates hepatic inflammation and fibrosis.
A: Representative images of liver sections stained with sirius red (original magnification 200 ×; scale bars, 100 µm); B and C: Α-SMA, COL1A1, COL1A2, COL3A1, COL4A2, TGFβ, TNFα, CCL2, CCL5, CCL20, and P16 mRNA levels in the livers of each group. All values are expressed as the mean ± SD; aP < 0.05 vs phosphate-buffered saline (PBS) group; bP < 0.01 vs PBS group; cP < 0.05 vs 3,5-diethoxycarbonyl-1,4-dihydrocollidine (DDC) + PBS group; dP < 0.01 vs DDC + PBS group; DDC: 3,5-diethoxycarbonyl-1,4-dihydrocollidine; PBS: Phosphate-buffered saline; L. garv: Lactococcus garvieae; TNFα: Tumor necrosis factor alpha; GAPDH: Glyceraldehyde 3-phosphate dehydrogenase.
- Citation: Liu M, Ji YL, Hu YJ, Su YX, Yang J, Wang XY, Chu HY, Zhang X, Dong SJ, Yang H, Liu YH, Zhou SM, Guo LP, Ran Y, Li YN, Zhao JW, Zhang ZG, Piao MY, Zhou L. Lactococcus garvieae aggravates cholestatic liver disease by increasing intestinal permeability and enhancing bile acid reabsorption. World J Gastroenterol 2025; 31(10): 101014
- URL: https://www.wjgnet.com/1007-9327/full/v31/i10/101014.htm
- DOI: https://dx.doi.org/10.3748/wjg.v31.i10.101014


