Copyright
©The Author(s) 2025.
World J Gastroenterol. Jan 7, 2025; 31(1): 96199
Published online Jan 7, 2025. doi: 10.3748/wjg.v31.i1.96199
Published online Jan 7, 2025. doi: 10.3748/wjg.v31.i1.96199
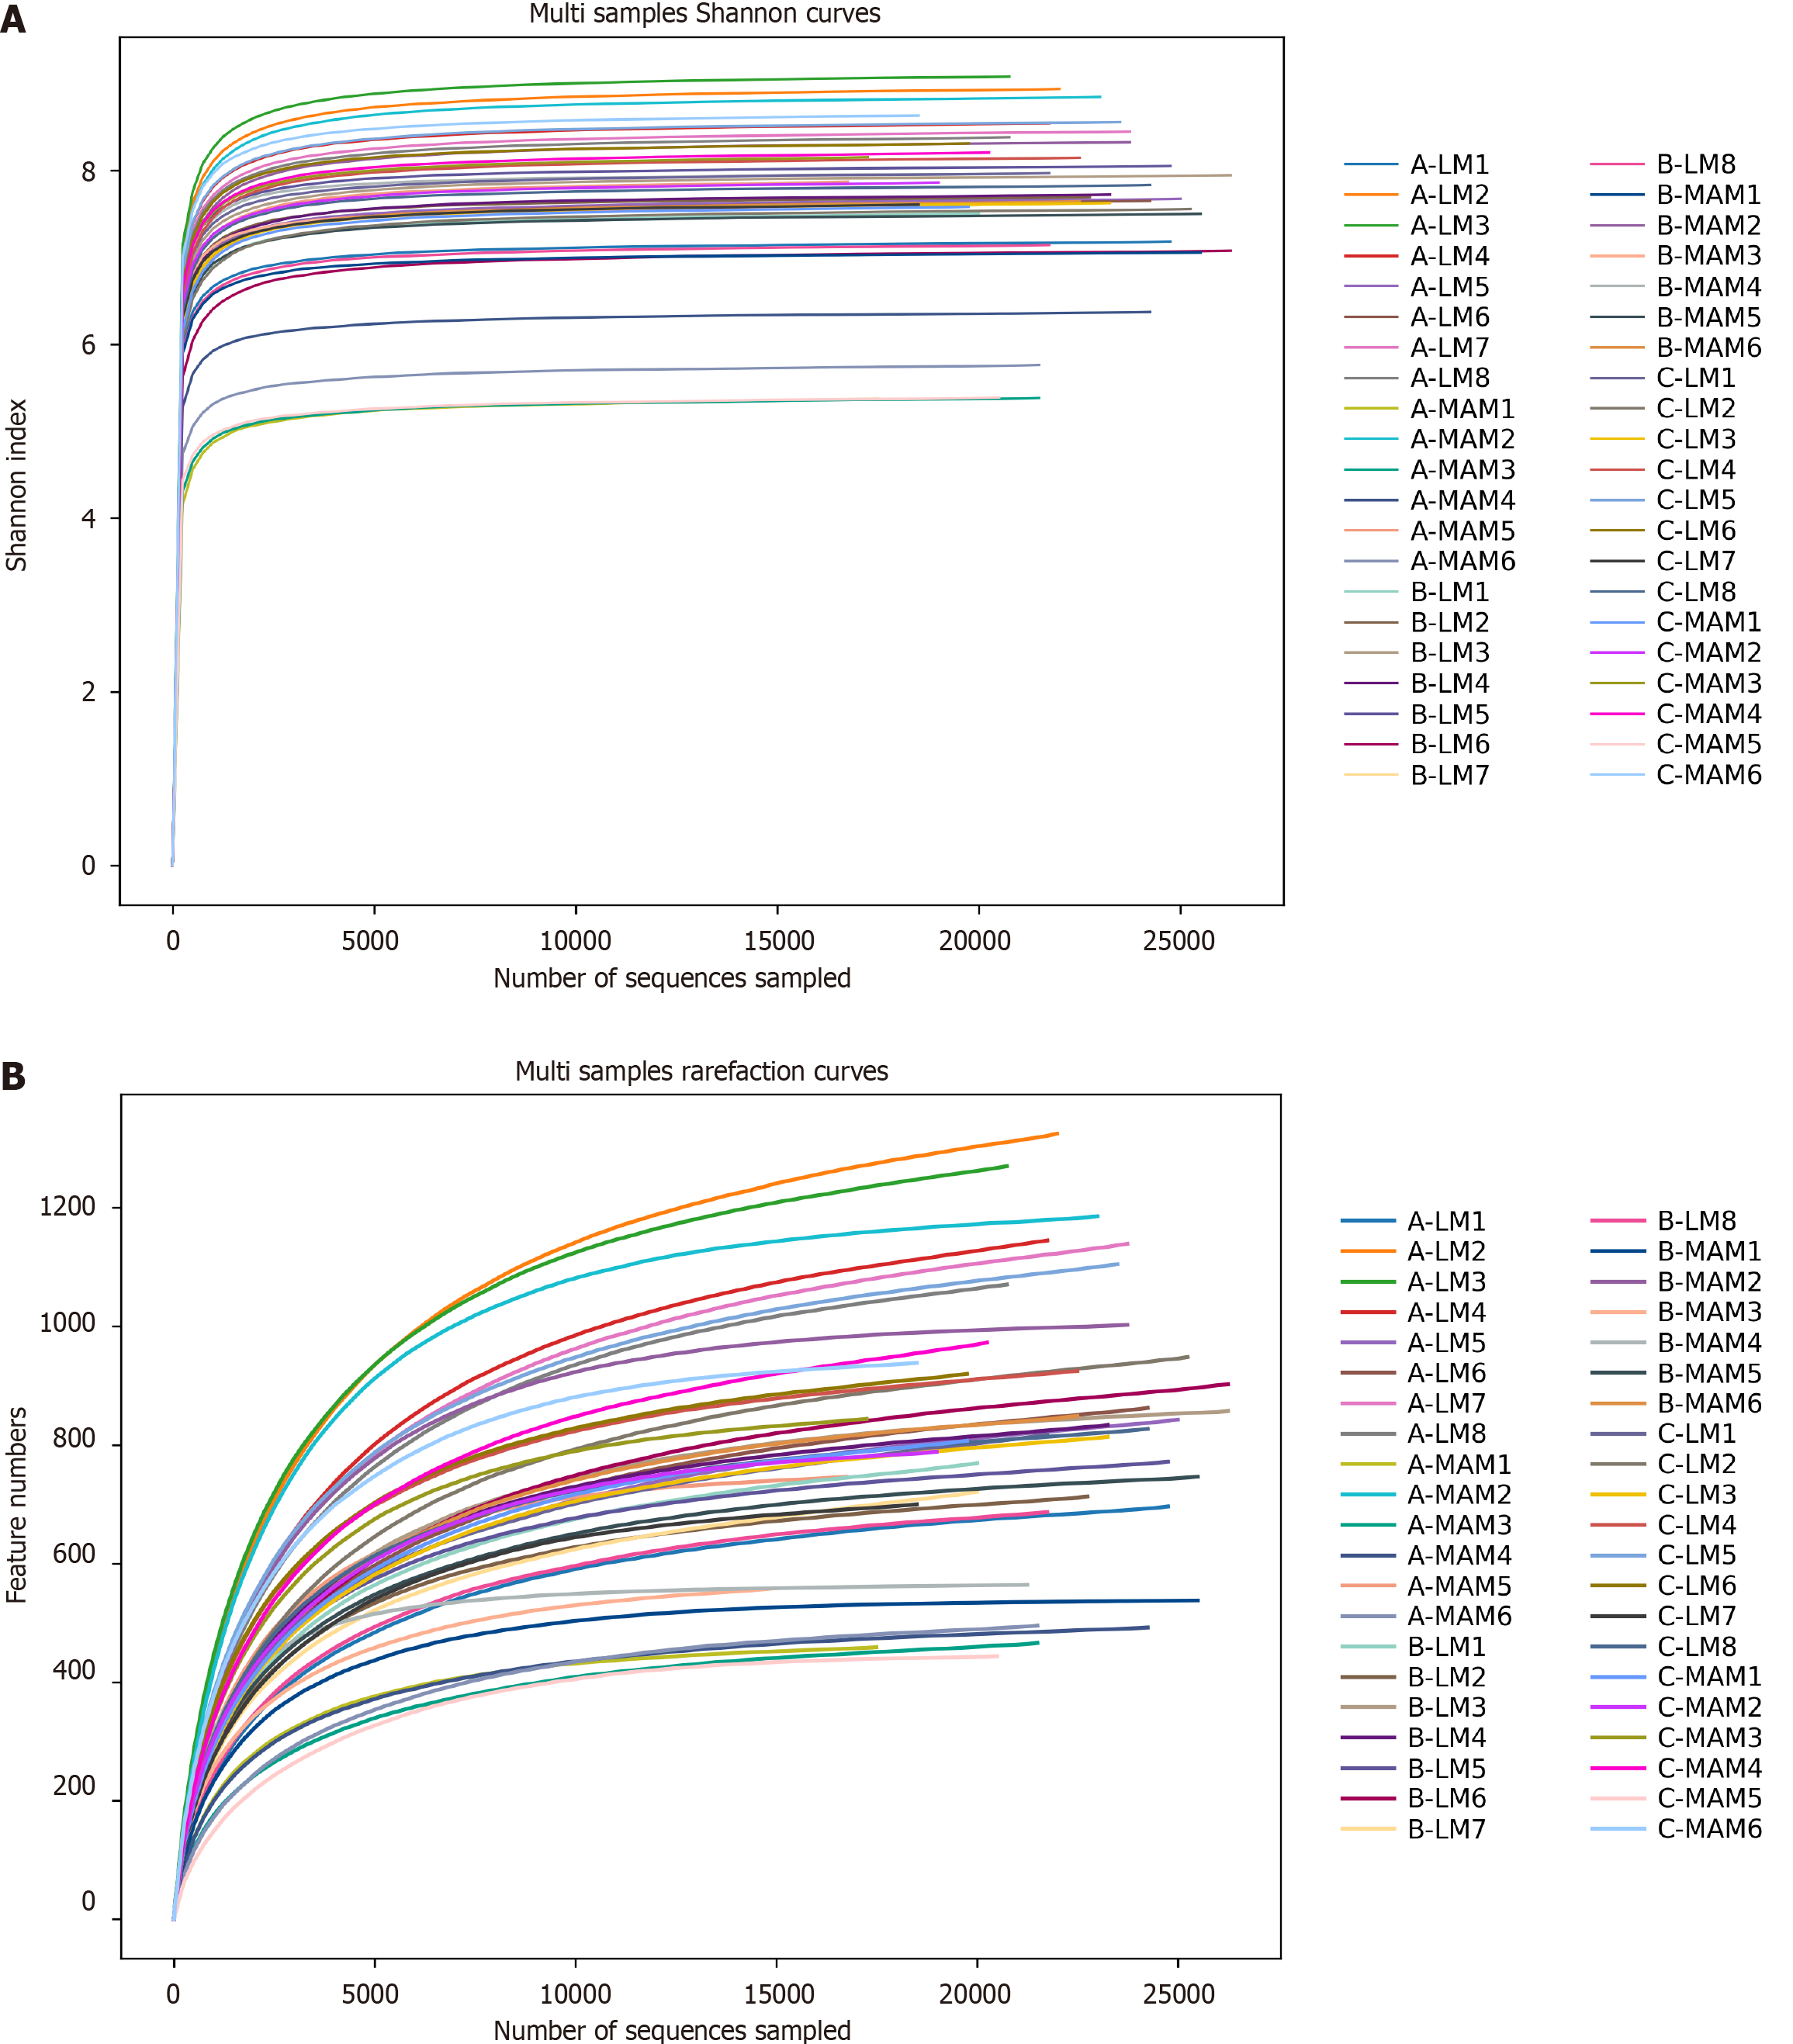
Figure 4 Shannon curve and rarefaction curve.
A: Multi samples Shannon curves; B: Multi samples Rarefaction curves. LM: Luminal microbiata stands for rat fecal stool flora; MAM: Mucosa-associated microbiota stands for colon mucosal flora; A, B, and C stand for control group, tail-hanging group, and tail-hanging to probiotics group, respectively.
- Citation: Zhang P, Zhu Y, Chen P, Zhou T, Han ZY, Xiao J, Ma JF, Ma W, Zang P, Chen Y. Effects of Bifidobacterium lactis BLa80 on fecal and mucosal flora and stem cell factor/c-kit signaling pathway in simulated microgravity rats. World J Gastroenterol 2025; 31(1): 96199
- URL: https://www.wjgnet.com/1007-9327/full/v31/i1/96199.htm
- DOI: https://dx.doi.org/10.3748/wjg.v31.i1.96199


