Copyright
©The Author(s) 2024.
World J Gastroenterol. Mar 7, 2024; 30(9): 1224-1236
Published online Mar 7, 2024. doi: 10.3748/wjg.v30.i9.1224
Published online Mar 7, 2024. doi: 10.3748/wjg.v30.i9.1224
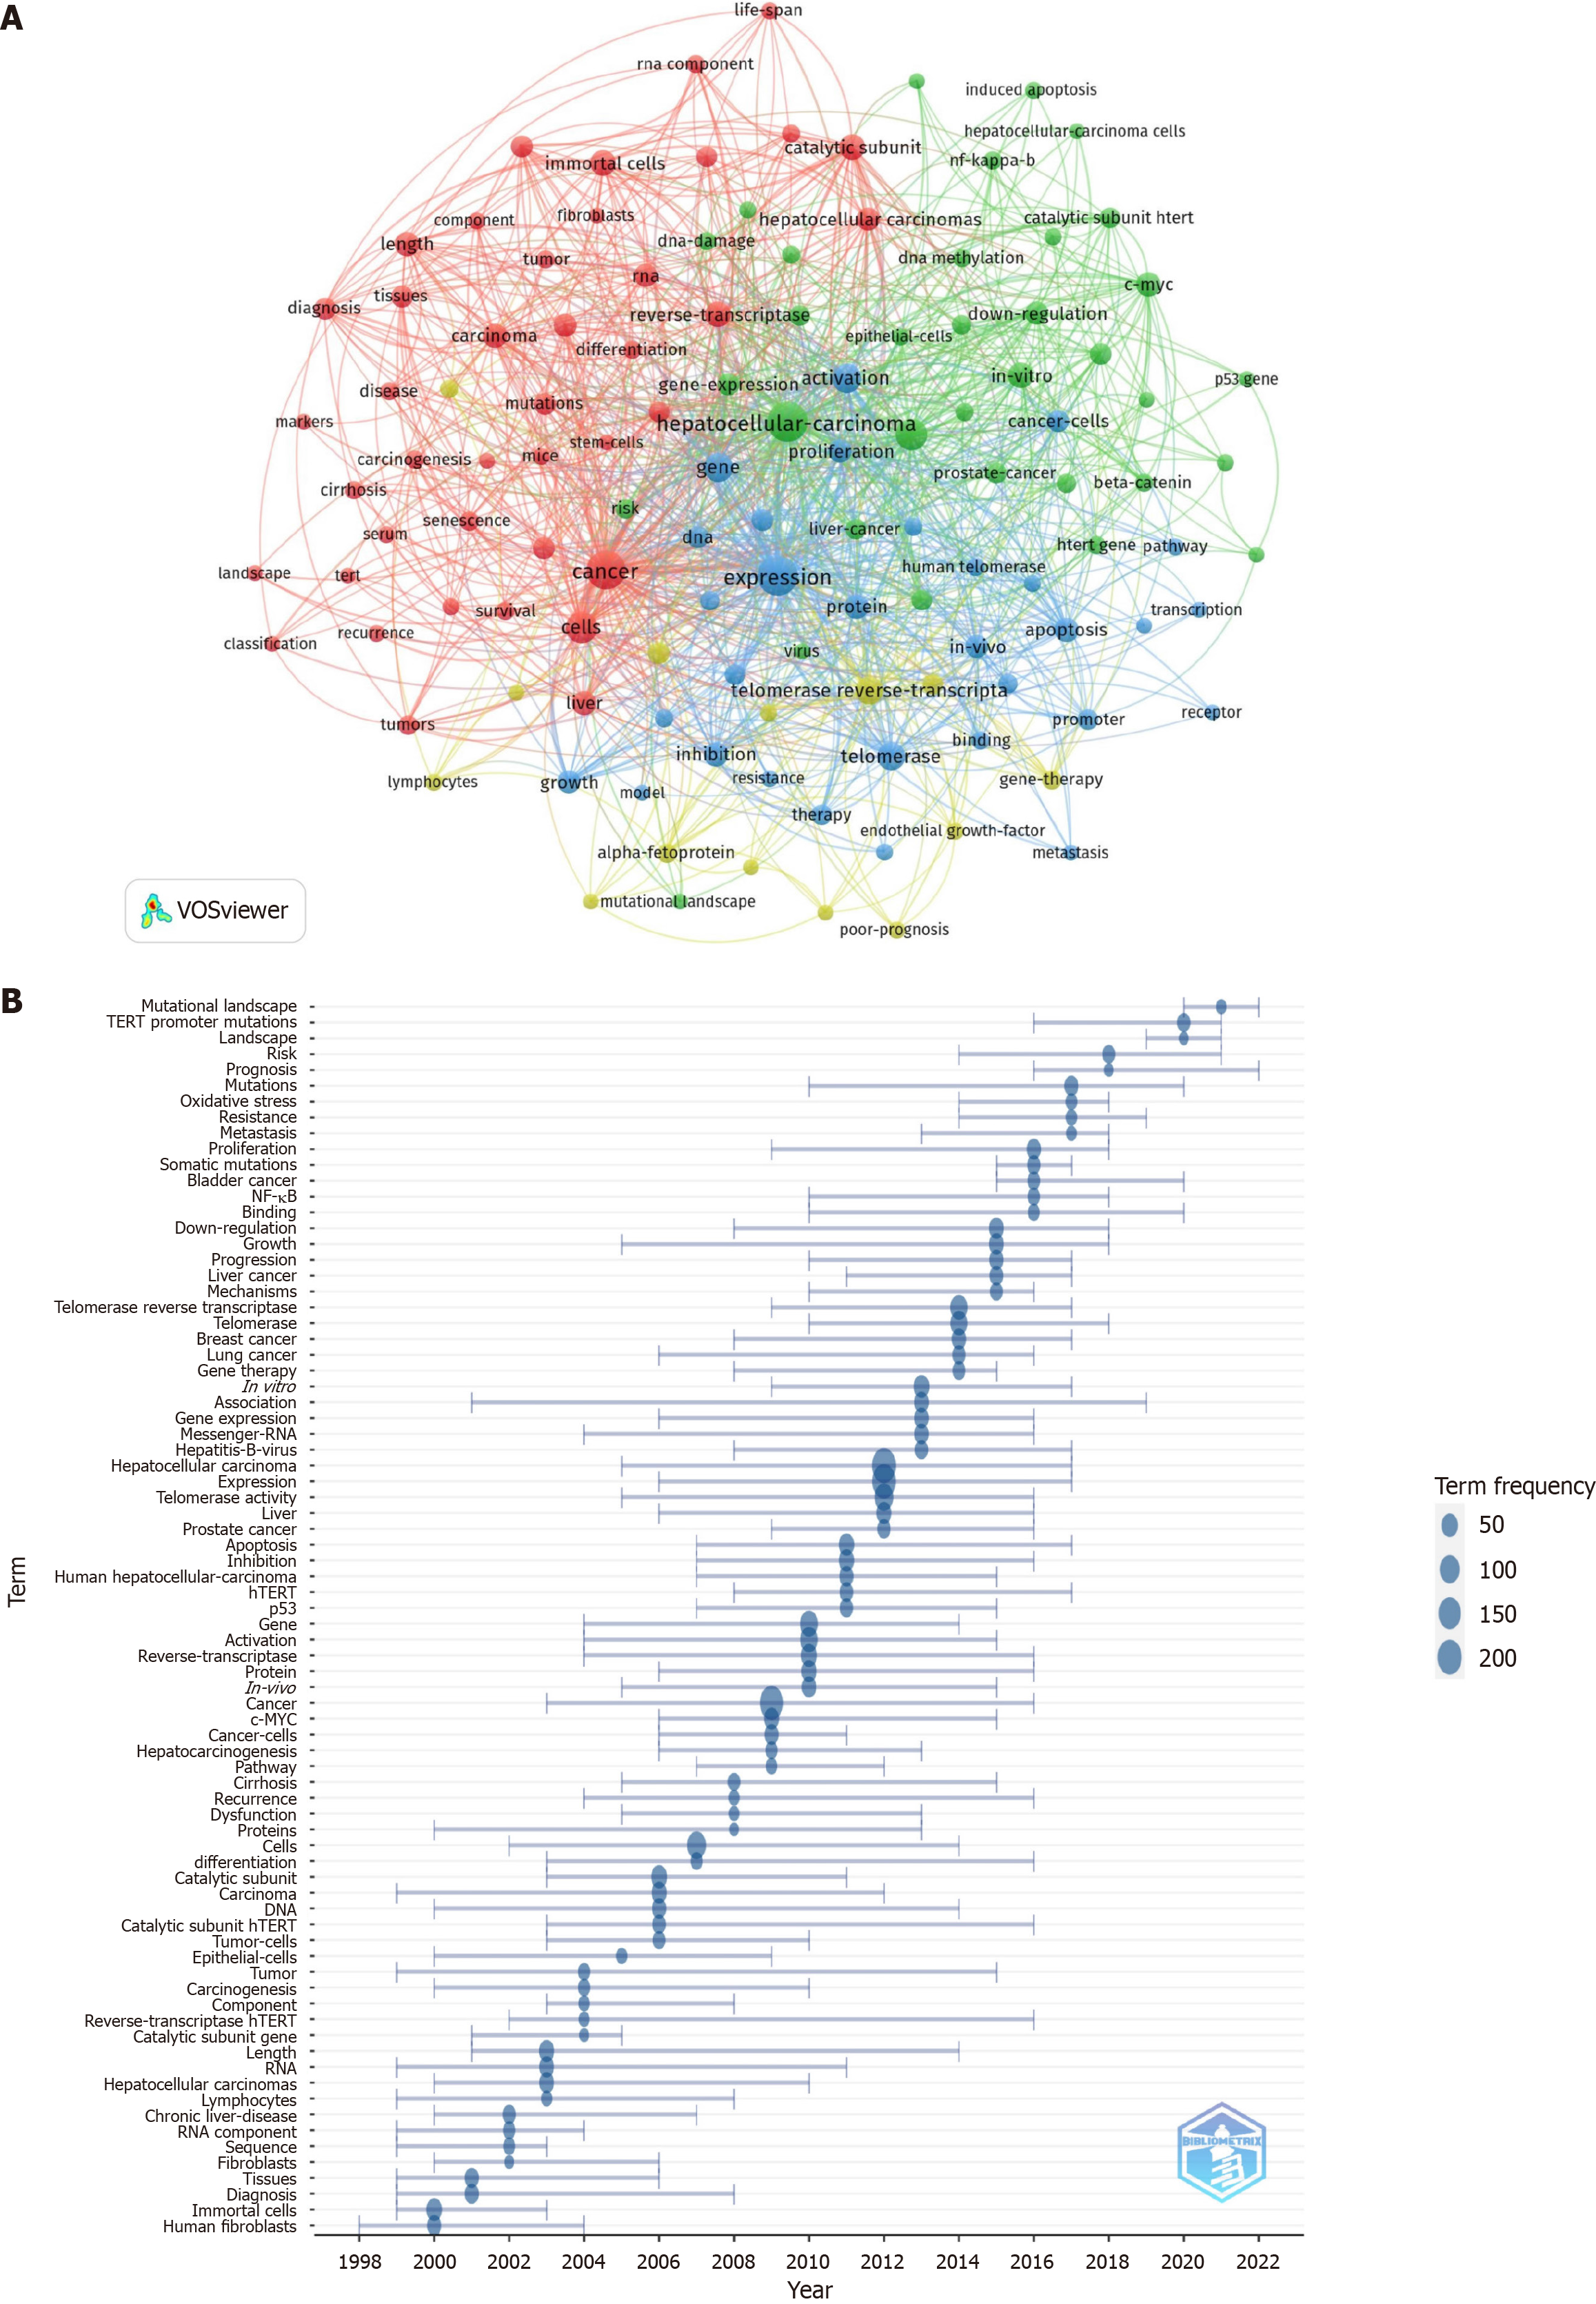
Figure 4 Co-occurrence analysis of keywords.
A: Cluster map of the keyword co-occurrence analysis, drawn with VOSviewer. Each color represents a cluster, and the size of each node represents the number of occurrences; B: The chart depicts the temporal evolution of the predominant keywords for each year, where the magnitude of the blue nodes reflects the frequency of keyword occurrences. Up to five keywords are presented for each year.
- Citation: Li HY, Zheng LL, Hu N, Wang ZH, Tao CC, Wang YR, Liu Y, Aizimuaji Z, Wang HW, Zheng RQ, Xiao T, Rong WQ. Telomerase-related advances in hepatocellular carcinoma: A bibliometric and visual analysis. World J Gastroenterol 2024; 30(9): 1224-1236
- URL: https://www.wjgnet.com/1007-9327/full/v30/i9/1224.htm
- DOI: https://dx.doi.org/10.3748/wjg.v30.i9.1224


