Copyright
©The Author(s) 2024.
World J Gastroenterol. Feb 28, 2024; 30(8): 919-942
Published online Feb 28, 2024. doi: 10.3748/wjg.v30.i8.919
Published online Feb 28, 2024. doi: 10.3748/wjg.v30.i8.919
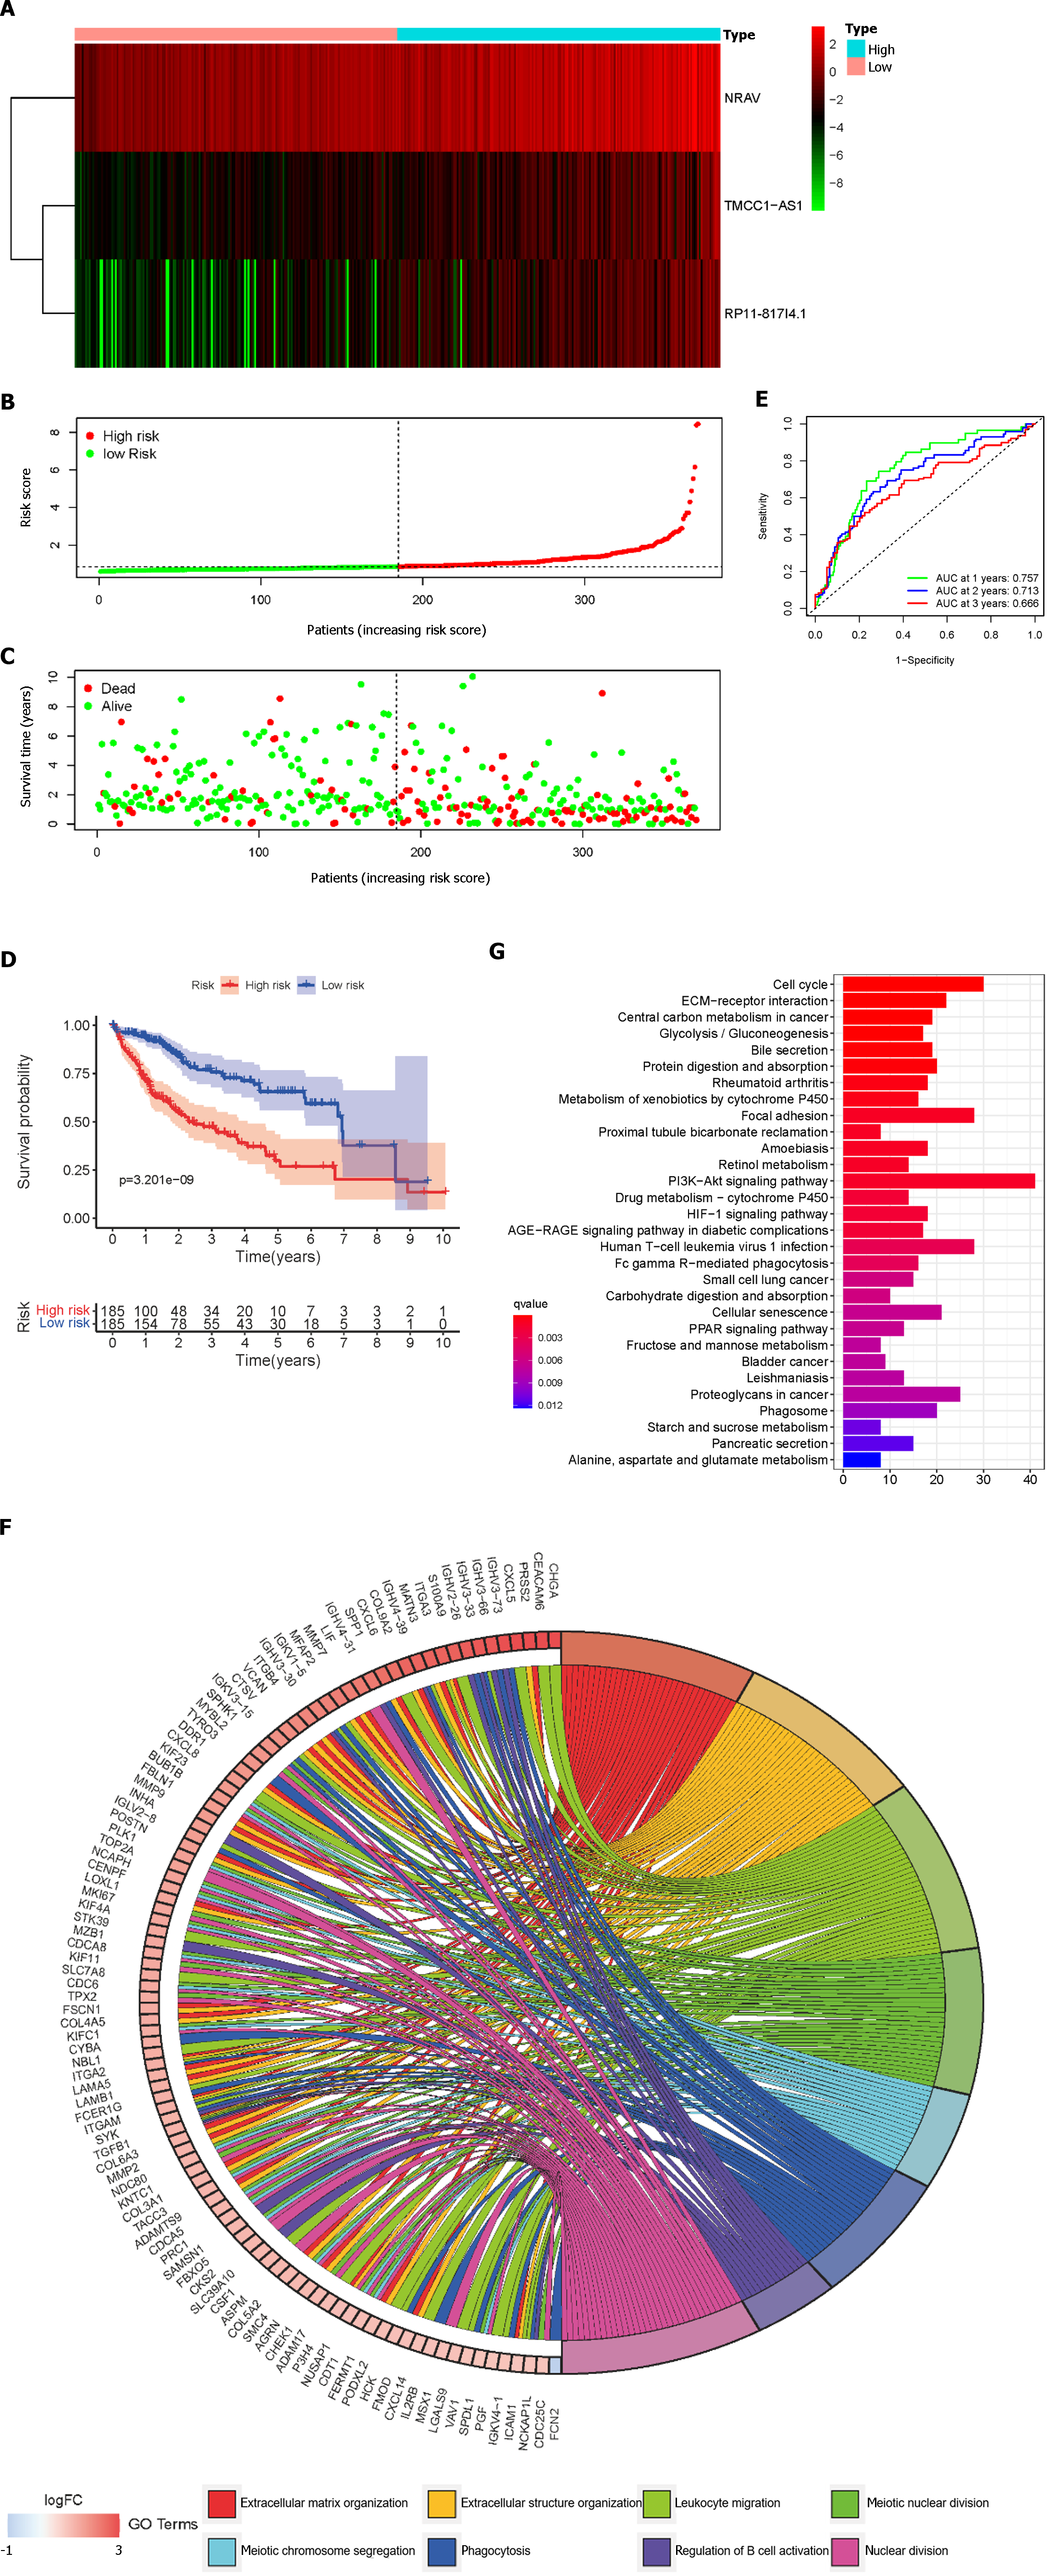
Figure 3 Lipid metabolism-related long noncoding RNAs in hepatocellular carcinoma patients from the The Cancer Genome Atlas cohort.
A: The distribution of patients in the high-risk group and low-risk group; B: Heatmap demonstrating the distribution of the expression of the three long non-coding RNAs in the The Cancer Genome Atlas (TCGA) cohort; C: Survival status of the high-risk and low-risk groups; D: Kaplan-Meier survival curve of overall survival in HCC patients in the TCGA cohort according to the median cutoff value; E: Receiver Operating Characteristic Curves at 1, 2, and 3 years in the TCGA cohort; F and G: Functional enrichment analysis of the lipid metabolism-related risk signatures: Gene Ontology-biological process analysis, Kyoto Encyclopedia of Genes and Genomes analysis. NRAV: Negative regulator of antiviral response; TMCC1-AS1: RNA transmembrane and coiled-coil domain family 1 antisense RNA 1; AUC: Area under curve.
- Citation: Wang RY, Yang JL, Xu N, Xu J, Yang SH, Liang DM, Li JZ, Zhu H. Lipid metabolism-related long noncoding RNA RP11-817I4.1 promotes fatty acid synthesis and tumor progression in hepatocellular carcinoma. World J Gastroenterol 2024; 30(8): 919-942
- URL: https://www.wjgnet.com/1007-9327/full/v30/i8/919.htm
- DOI: https://dx.doi.org/10.3748/wjg.v30.i8.919


