Copyright
©The Author(s) 2024.
World J Gastroenterol. Feb 28, 2024; 30(8): 901-918
Published online Feb 28, 2024. doi: 10.3748/wjg.v30.i8.901
Published online Feb 28, 2024. doi: 10.3748/wjg.v30.i8.901
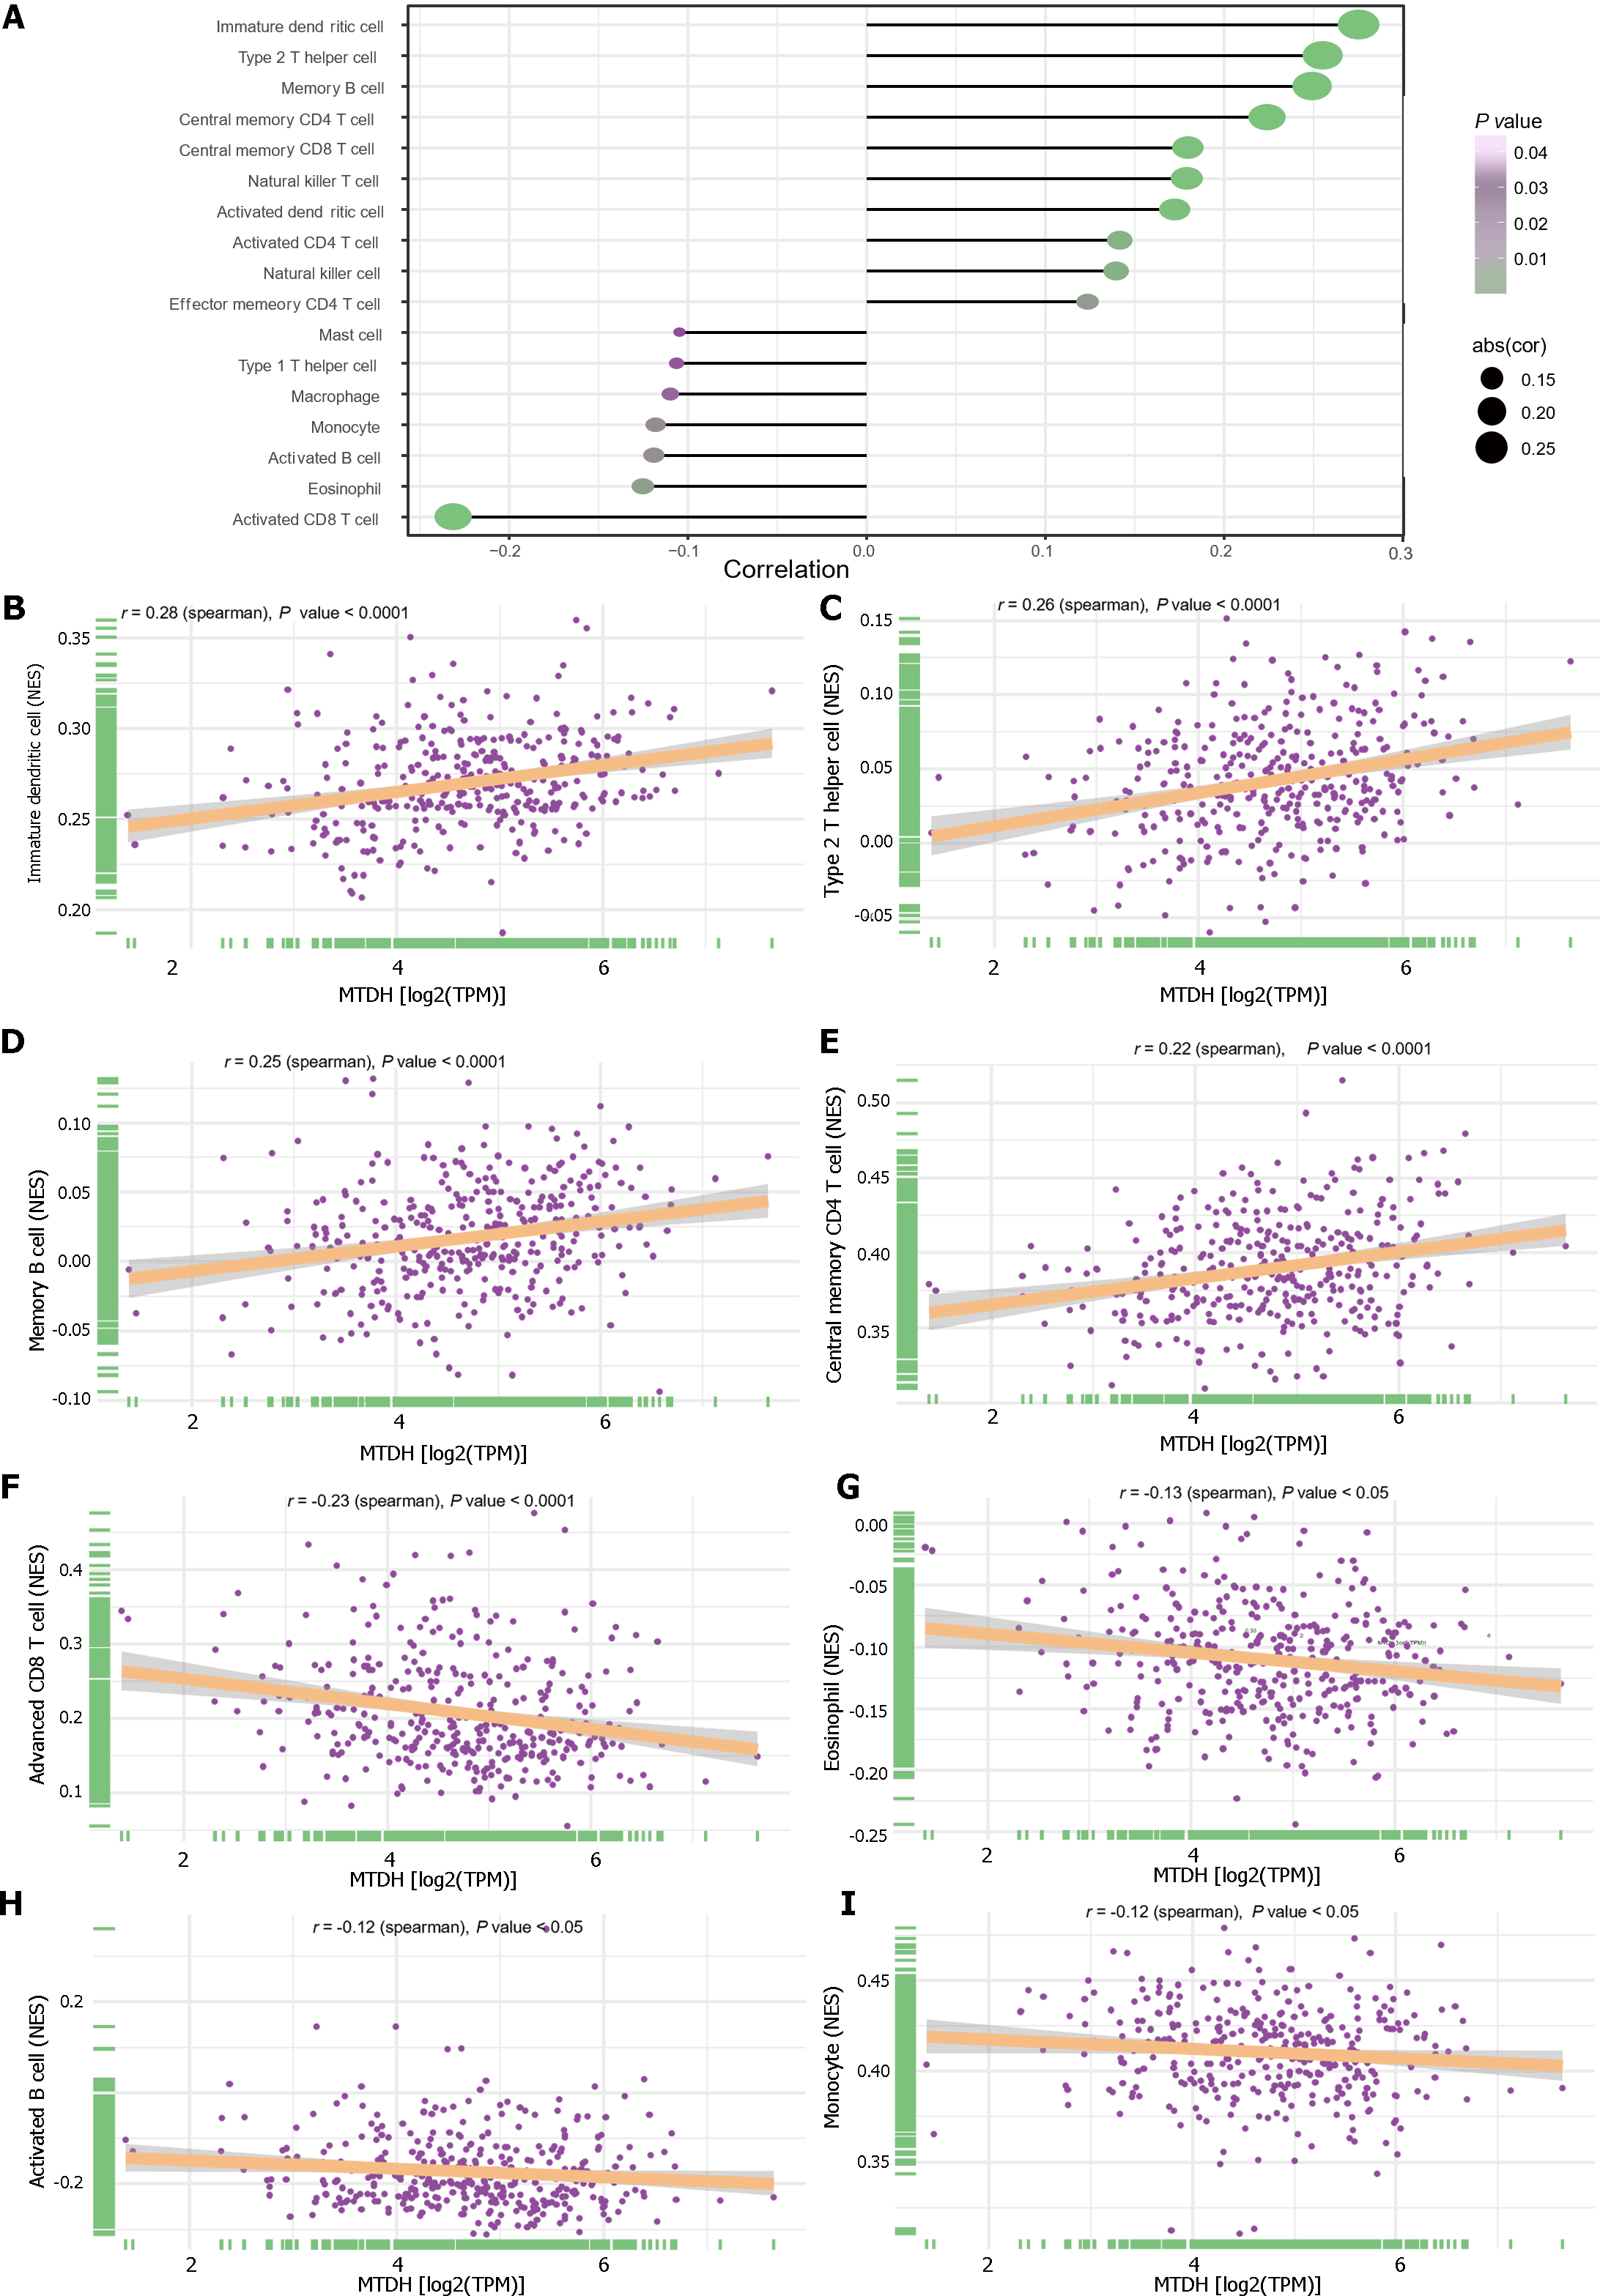
Figure 8 Immune infiltration and Metadherin expression levels.
A: Metadherin (MTDH) expression levels correlated with infiltration of immune cells; B: Correlations between MTDH and immature dendritic cells (r = 0.28, P < 0.0001); C: Correlations between MTDH and T helper 2 cells (r = 0.26, P < 0.0001); D: Correlations between MTDH and memory B cells (r = 0.25, P < 0.0001); E: Correlations between MTDH and central memory CD4 T cells (r = 0.22, P < 0.0001); F: Correlations between MTDH and activated CD8 T cell (r = -0.23, P < 0.0001); G: Correlations between MTDH and eosinophils (r = -0.13, P < 0.05); H: Correlations between MTDH and activated B cells (r =-0.12, P < 0.05); I: Correlations between MTDH and monocytes (r = -0.12, P < 0.05). MTDH: Metadherin.
- Citation: Wang YY, Shen MM, Gao J. Metadherin promotes stem cell phenotypes and correlated with immune infiltration in hepatocellular carcinoma. World J Gastroenterol 2024; 30(8): 901-918
- URL: https://www.wjgnet.com/1007-9327/full/v30/i8/901.htm
- DOI: https://dx.doi.org/10.3748/wjg.v30.i8.901


