Copyright
©The Author(s) 2024.
World J Gastroenterol. Feb 28, 2024; 30(8): 881-900
Published online Feb 28, 2024. doi: 10.3748/wjg.v30.i8.881
Published online Feb 28, 2024. doi: 10.3748/wjg.v30.i8.881
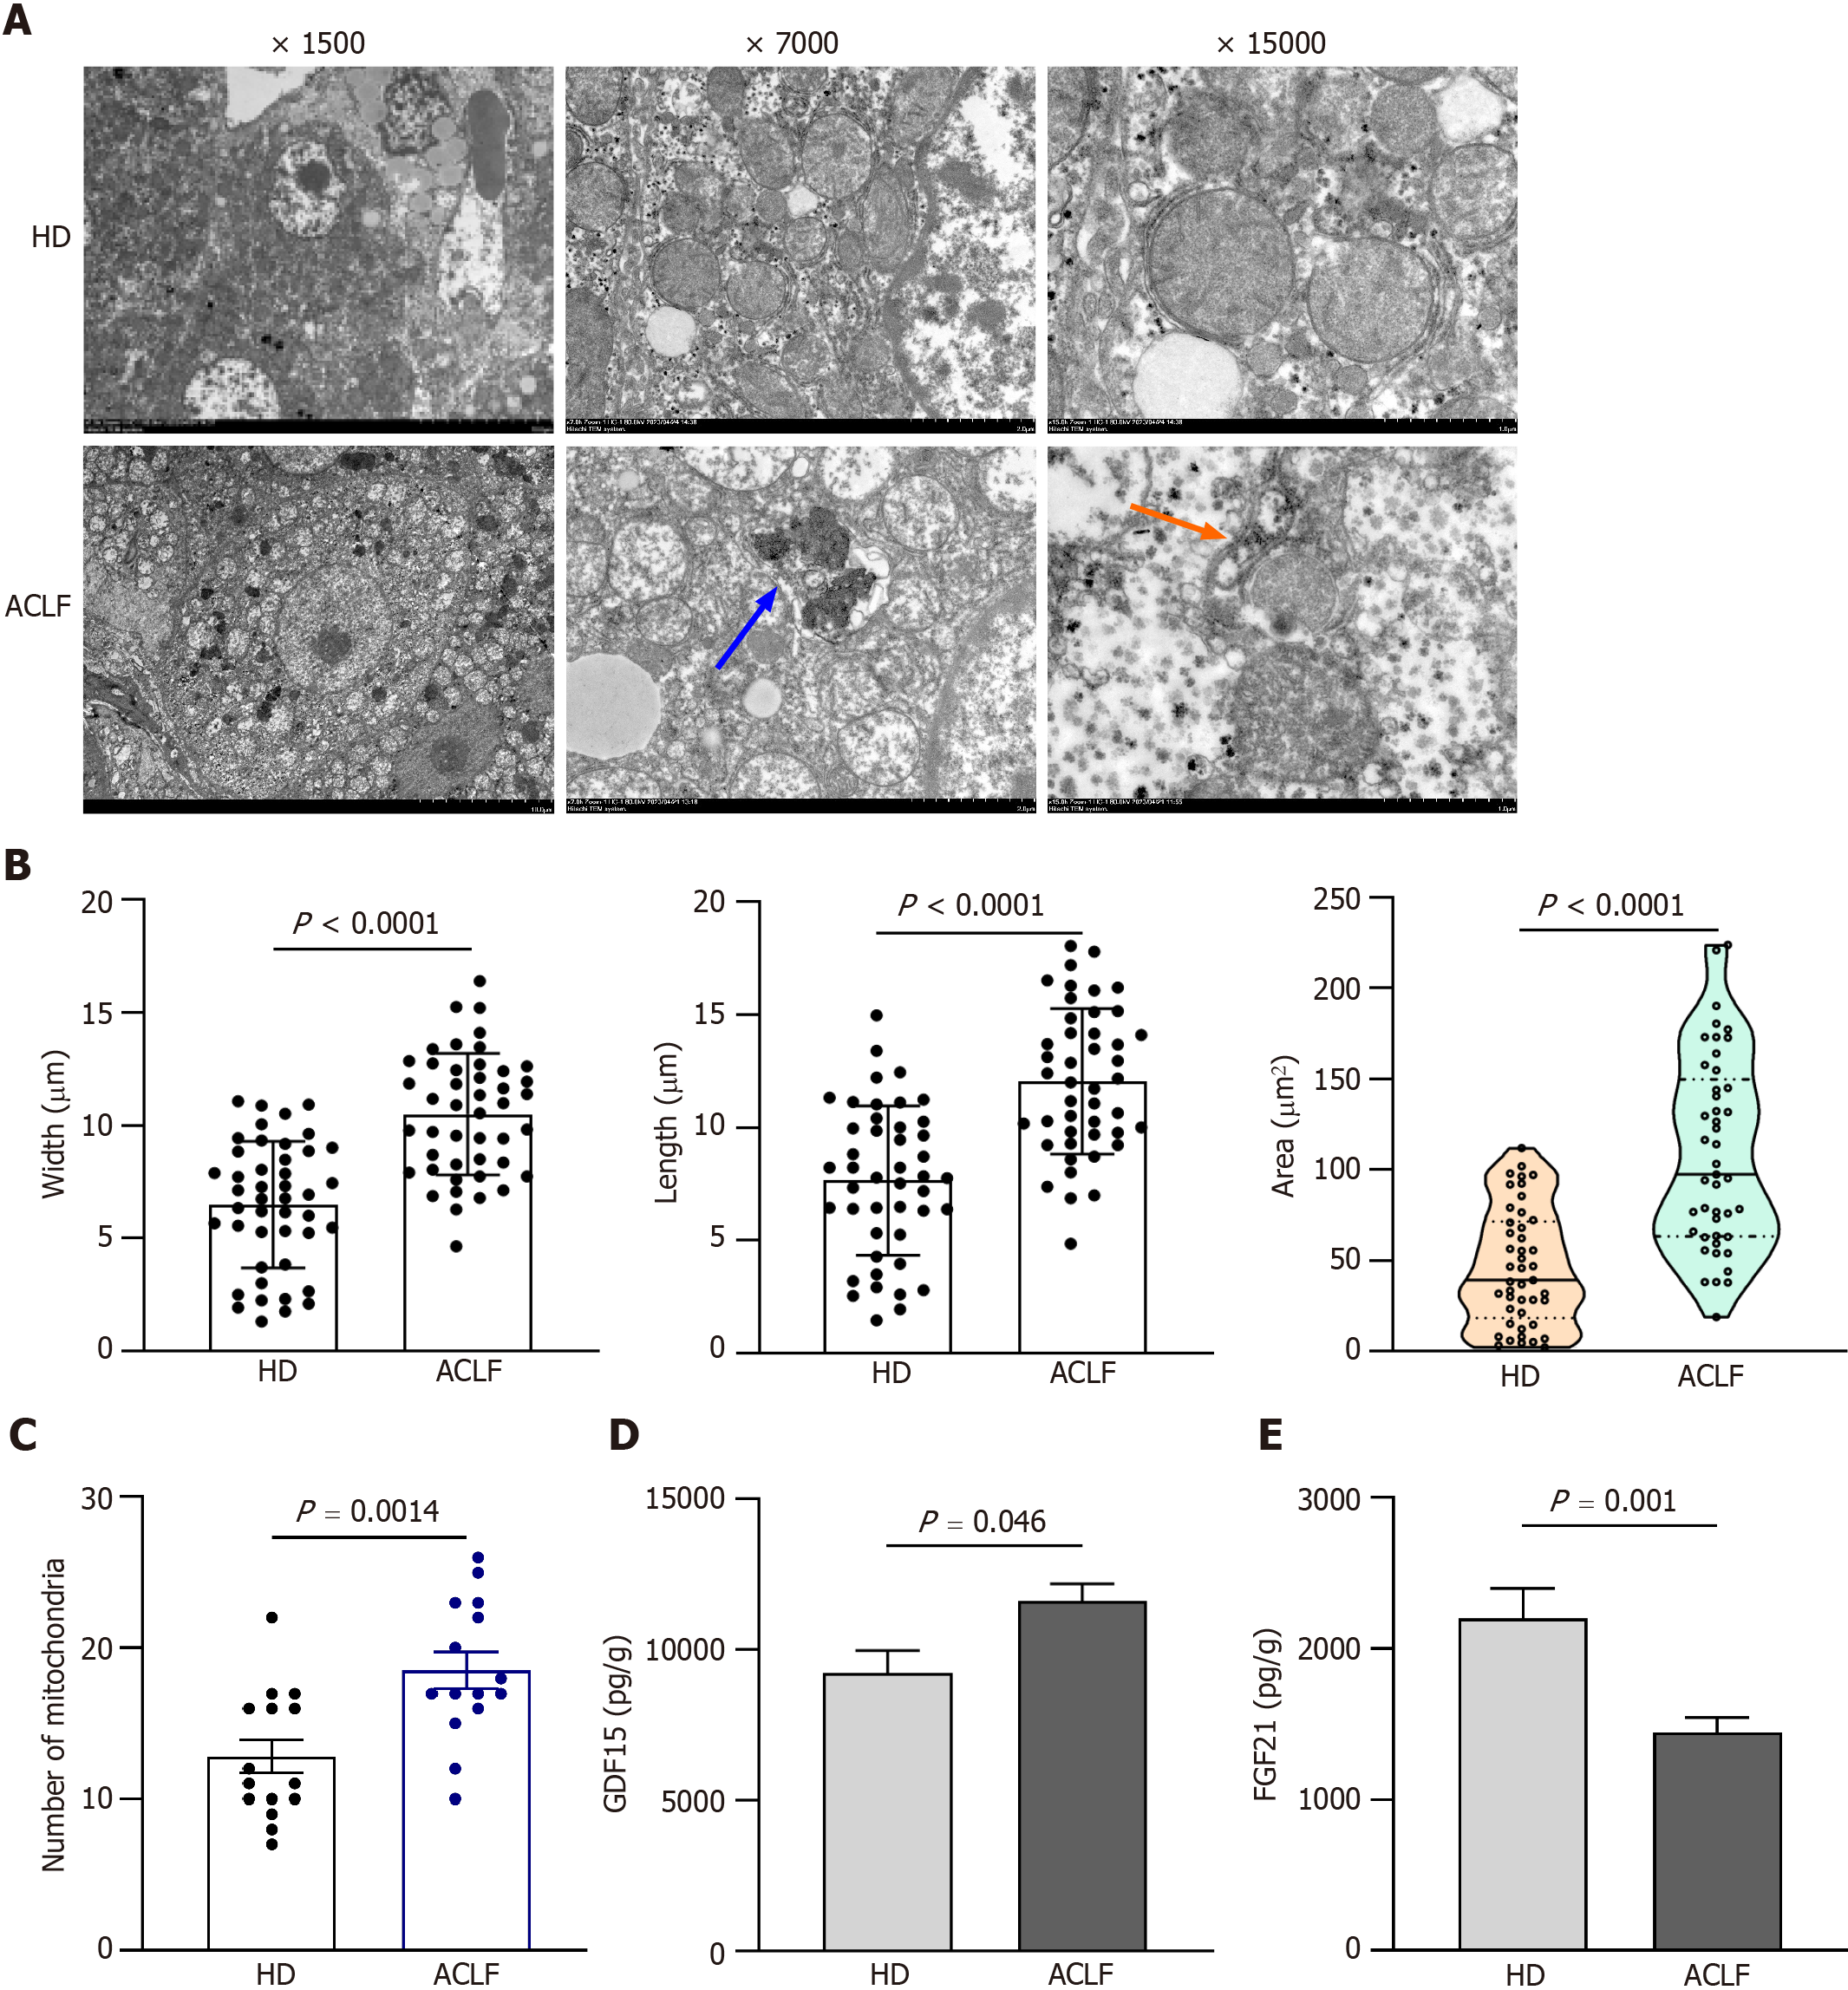
Figure 3 Mitochondrial morphology and function in the liver of patients with acute-on-chronic liver failure.
A: Representative electron microscopy images of hepatic mitochondria from 3 patients with acute-on-chronic liver failure (ACLF) and 3 healthy donors (HDs). Orange arrows indicate autophagosome; the blue arrow indicates autophagic lysosome; B: Length, width, and area of each mitochondrion; C: Number of mitochondria at original magnification of 7000 ; D: Growth differentiation factor 15 levels in liver homogenates of 12 HDs and 17 patients with ACLF; E: Fibroblast growth factor 21 levels in liver homogenates. Data with normal distribution were compared using unpaired student’s t-test, and the Mann-Whitney test was used for non-normal data. ACLF: Acute-on-chronic liver failure; HD: Healthy donor; GDF15: Growth differentiation factor 15; FGF21: Fibroblast growth factor 21.
- Citation: Zhang Y, Tian XL, Li JQ, Wu DS, Li Q, Chen B. Mitochondrial dysfunction affects hepatic immune and metabolic remodeling in patients with hepatitis B virus-related acute-on-chronic liver failure. World J Gastroenterol 2024; 30(8): 881-900
- URL: https://www.wjgnet.com/1007-9327/full/v30/i8/881.htm
- DOI: https://dx.doi.org/10.3748/wjg.v30.i8.881


