Copyright
©The Author(s) 2024.
World J Gastroenterol. Feb 28, 2024; 30(8): 863-880
Published online Feb 28, 2024. doi: 10.3748/wjg.v30.i8.863
Published online Feb 28, 2024. doi: 10.3748/wjg.v30.i8.863
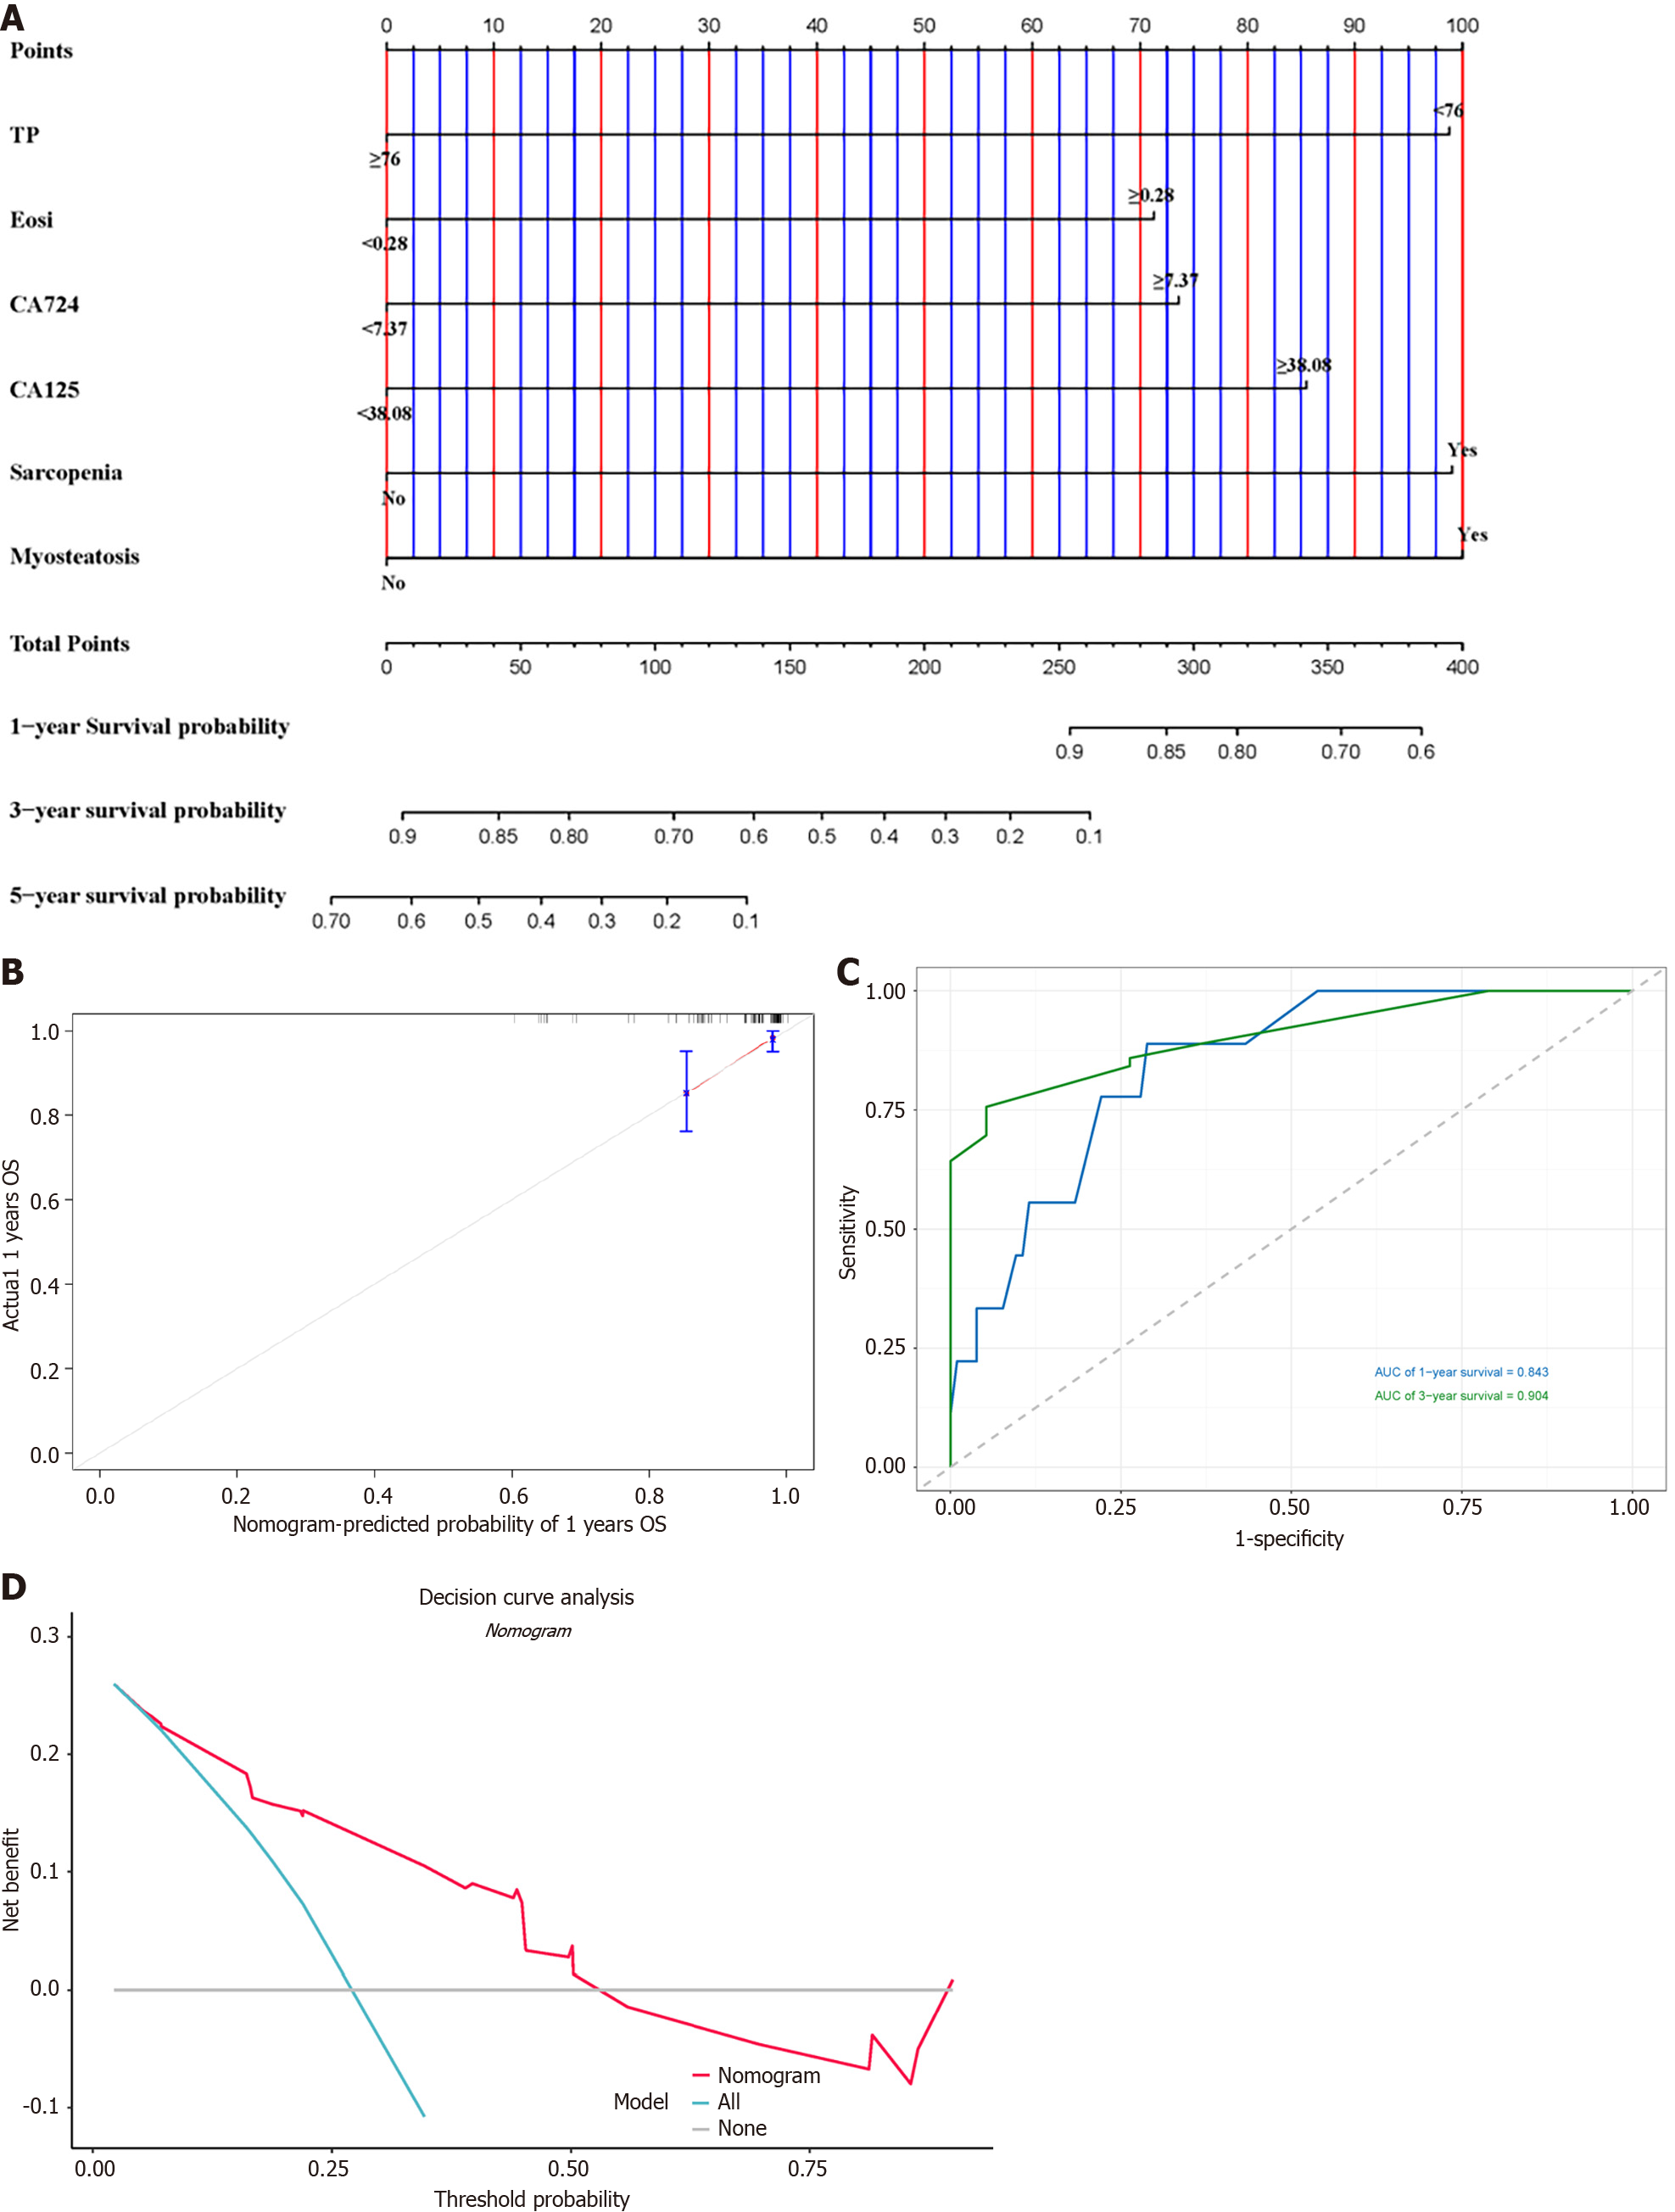
Figure 7 Nomogram for overall survival.
A: Nomogram for overall survival (OS); B: One-year and 3-year area under the curves for OS; C: Calibration curves for OS; D: Decision curve analysis for OS. AUC: Area under the curve; OS: Overall survival; TP: Total protein; Eosi: Eosinophil count; CA724: Carbohydrate antigen 724; CA125: Carbohydrate antigen 125.
- Citation: Deng GM, Song HB, Du ZZ, Xue YW, Song HJ, Li YZ. Evaluating the influence of sarcopenia and myosteatosis on clinical outcomes in gastric cancer patients undergoing immune checkpoint inhibitor. World J Gastroenterol 2024; 30(8): 863-880
- URL: https://www.wjgnet.com/1007-9327/full/v30/i8/863.htm
- DOI: https://dx.doi.org/10.3748/wjg.v30.i8.863


