Copyright
©The Author(s) 2024.
World J Gastroenterol. Feb 14, 2024; 30(6): 579-598
Published online Feb 14, 2024. doi: 10.3748/wjg.v30.i6.579
Published online Feb 14, 2024. doi: 10.3748/wjg.v30.i6.579
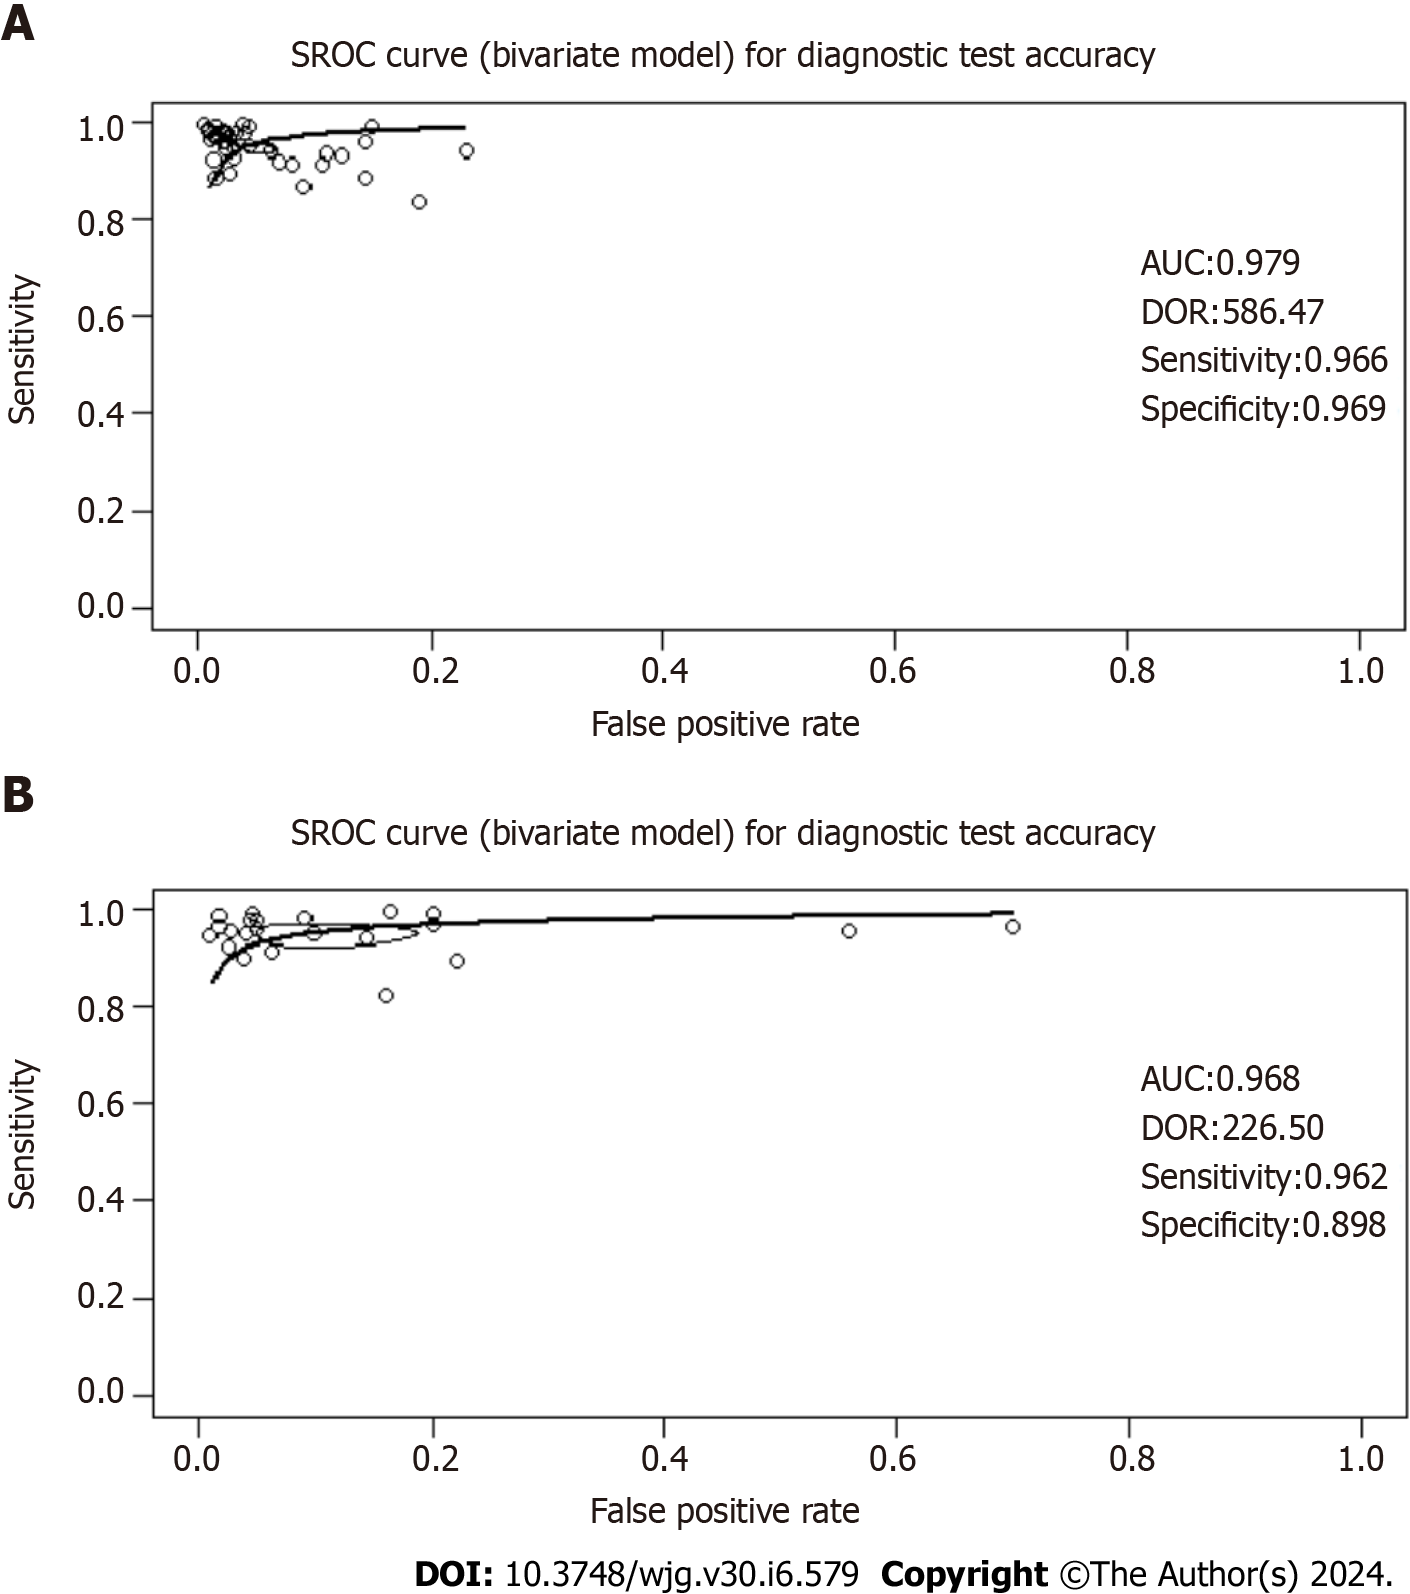
Figure 5 Summary operating characteristics curve curves for studies based on the 13C-urea breath test and the 14C-urea breath test for Helicobacter pylori infection in dyspeptic patients.
The summary operating characteristics curve (SROC) curve is a graphical representation that combines sensitivity and specificity data from multiple studies or diagnostic tests. It illustrates how these measures change with different threshold settings or study parameters. The curve is accompanied by the area under the curve (AUC), which provides a quantitative assessment of the test's overall performance. A higher AUC value indicates better discriminatory ability across tested thresholds. Furthermore, the diagnostic odds ratio (DOR) is derived from the ROC curve and offers an evaluation of the test's diagnostic precision. A higher DOR signifies stronger discriminatory power, reflecting the odds of a positive test result in individuals with the condition compared to those without it. A: SROC curve for studies based on the 13C-urea breath test (UBT) for Helicobacter pylori (H. pylori) infection in dyspeptic patients; B: SROC curve for studies based on the 14C-UBT for H. pylori infection in dyspeptic patients. SROC: Summary operating characteristics curve; AUC: Area under the curve; DOR: Diagnostic odds ratio.
- Citation: Lemos FFB, Castro CT, Silva Luz M, Rocha GR, Correa Santos GL, de Oliveira Silva LG, Calmon MS, Souza CL, Zarpelon-Schutz AC, Teixeira KN, Queiroz DMM, Freire de Melo F. Urea breath test for Helicobacter pylori infection in adult dyspeptic patients: A meta-analysis of diagnostic test accuracy. World J Gastroenterol 2024; 30(6): 579-598
- URL: https://www.wjgnet.com/1007-9327/full/v30/i6/579.htm
- DOI: https://dx.doi.org/10.3748/wjg.v30.i6.579


