Copyright
©The Author(s) 2024.
World J Gastroenterol. Feb 14, 2024; 30(6): 565-578
Published online Feb 14, 2024. doi: 10.3748/wjg.v30.i6.565
Published online Feb 14, 2024. doi: 10.3748/wjg.v30.i6.565
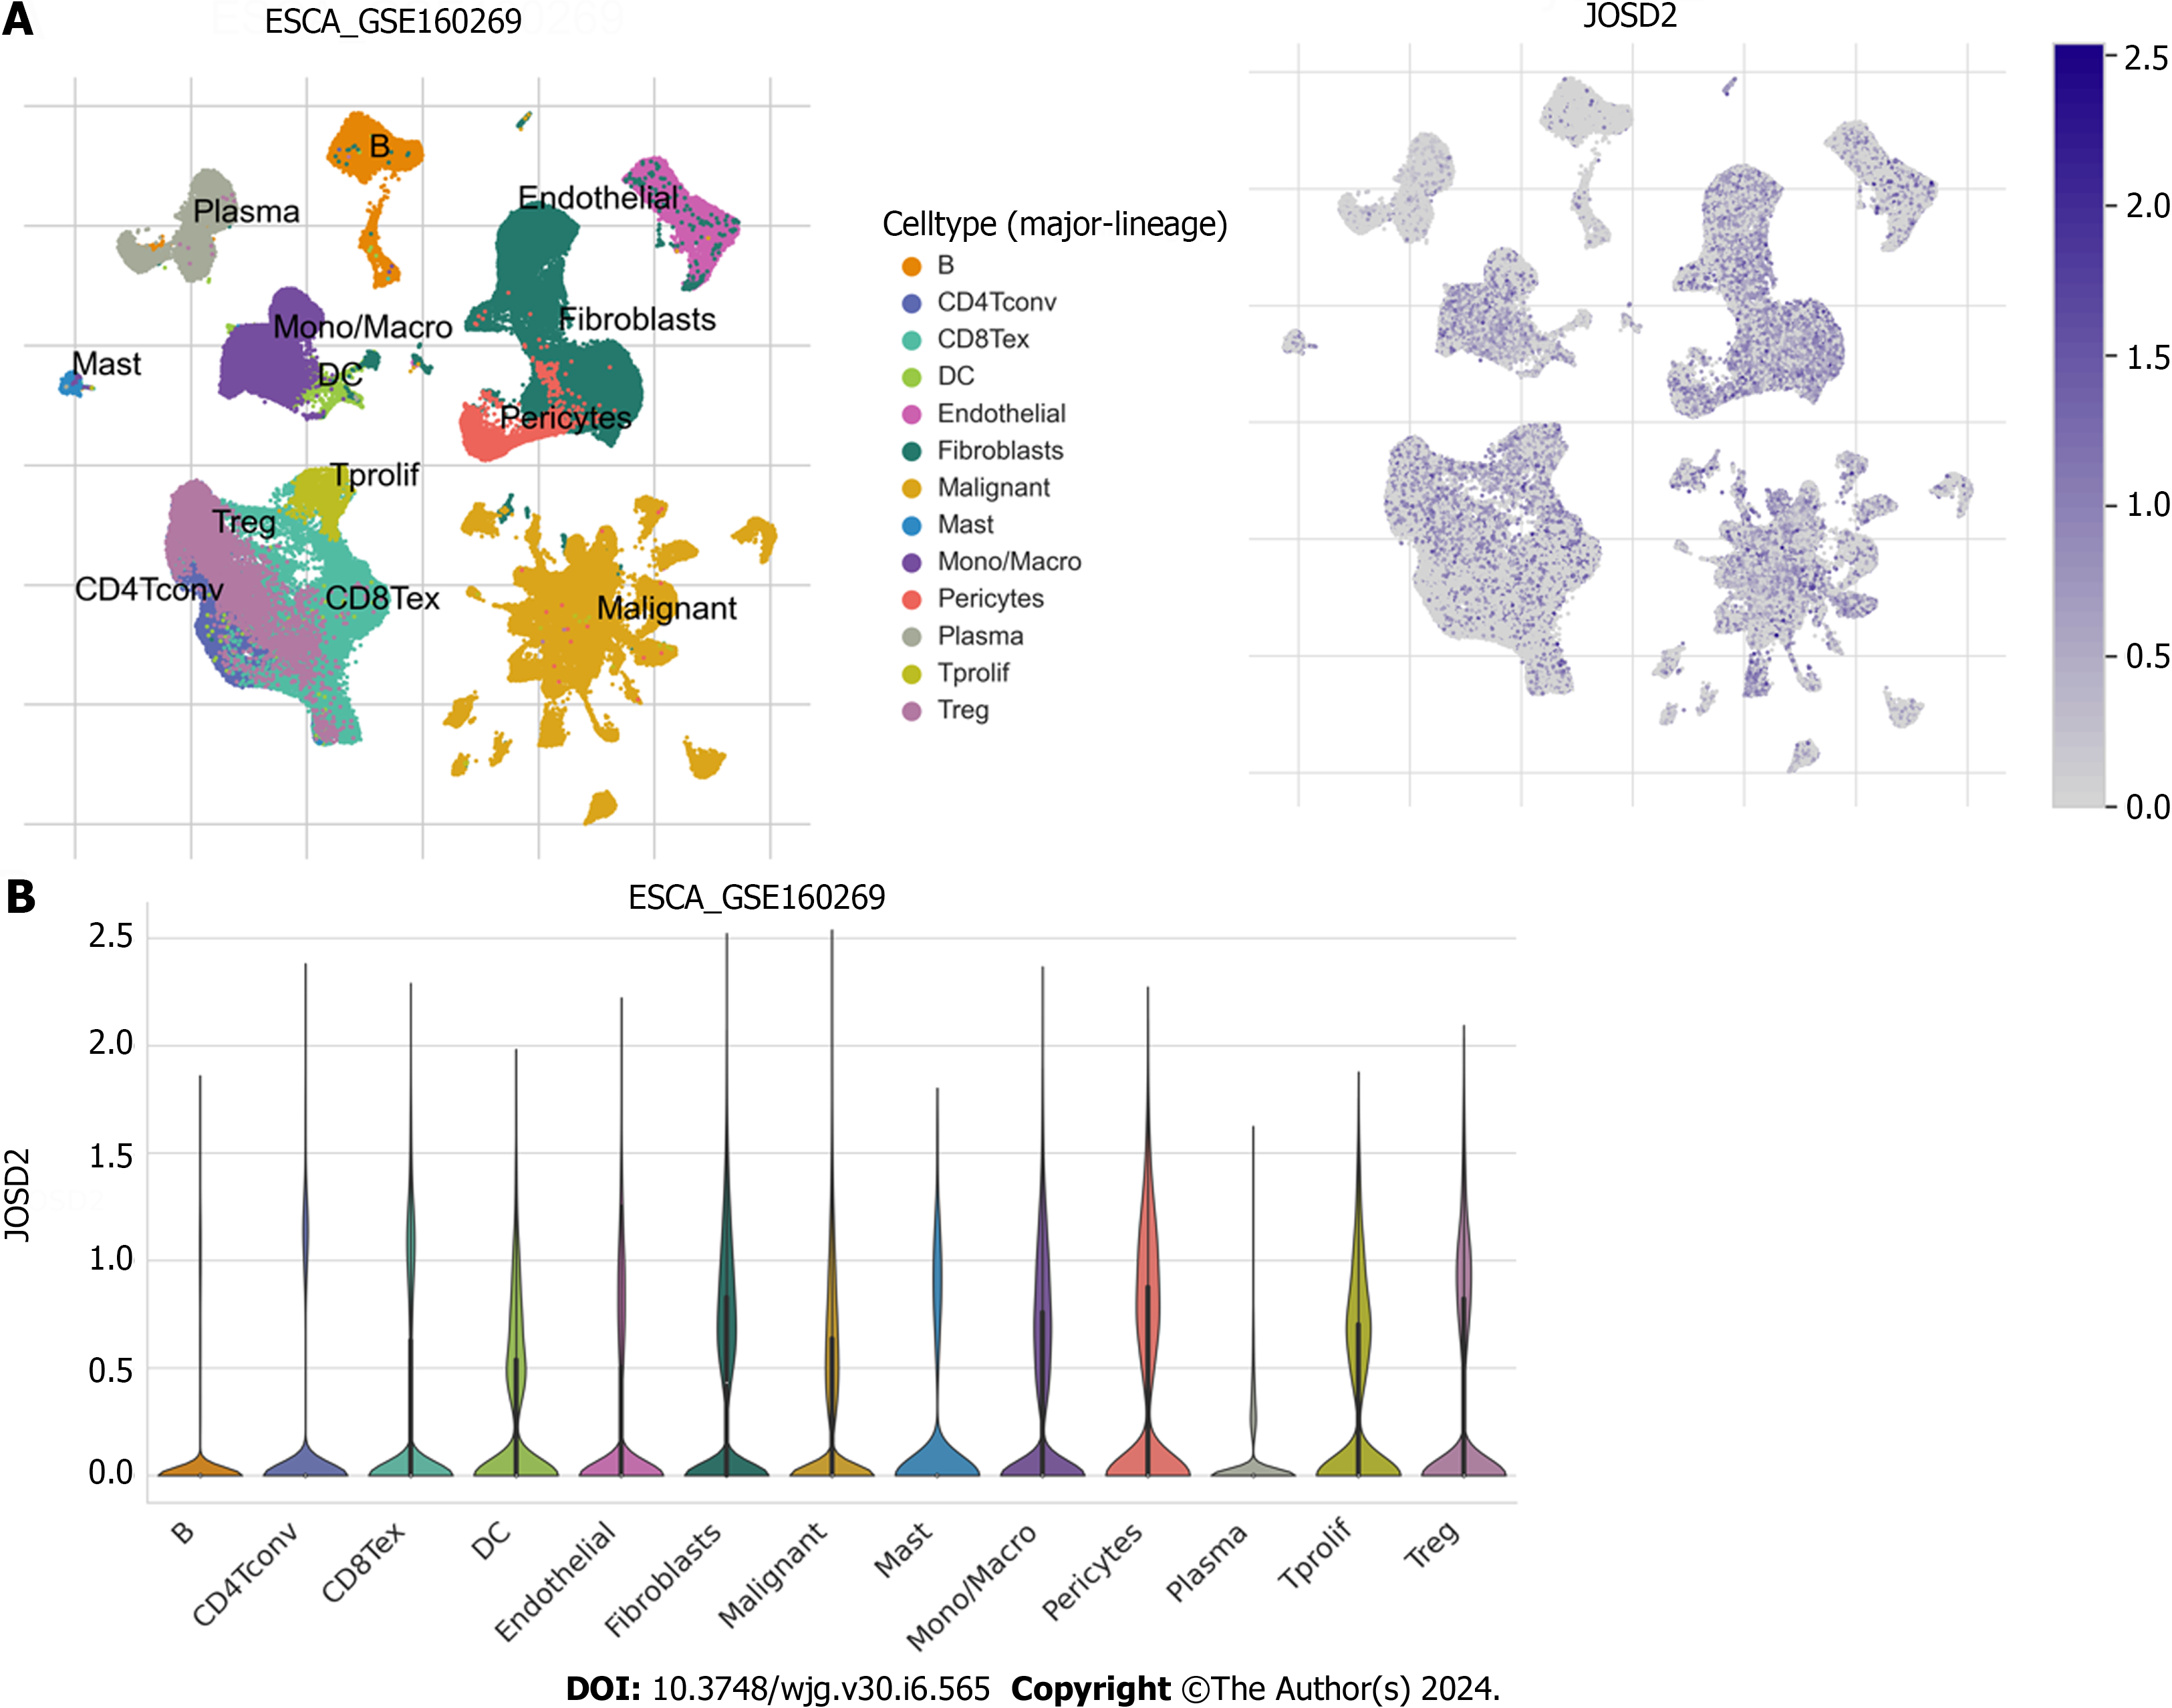
Figure 2 Single-cell sequencing data of esophageal squamous cell carcinoma in GSE160269.
A: Uniform manifold approximation and projection plots showing the grouping of different cell types (left) and the expression profile of JOSD2 (right) in different cell types; B: Violin plots showing JOSD2 expression in different cell types.
- Citation: Wang WP, Shi D, Yun D, Hu J, Wang JF, Liu J, Yang YP, Li MR, Wang JF, Kong DL. Role of deubiquitinase JOSD2 in the pathogenesis of esophageal squamous cell carcinoma. World J Gastroenterol 2024; 30(6): 565-578
- URL: https://www.wjgnet.com/1007-9327/full/v30/i6/565.htm
- DOI: https://dx.doi.org/10.3748/wjg.v30.i6.565


