Copyright
©The Author(s) 2024.
World J Gastroenterol. Feb 14, 2024; 30(6): 565-578
Published online Feb 14, 2024. doi: 10.3748/wjg.v30.i6.565
Published online Feb 14, 2024. doi: 10.3748/wjg.v30.i6.565
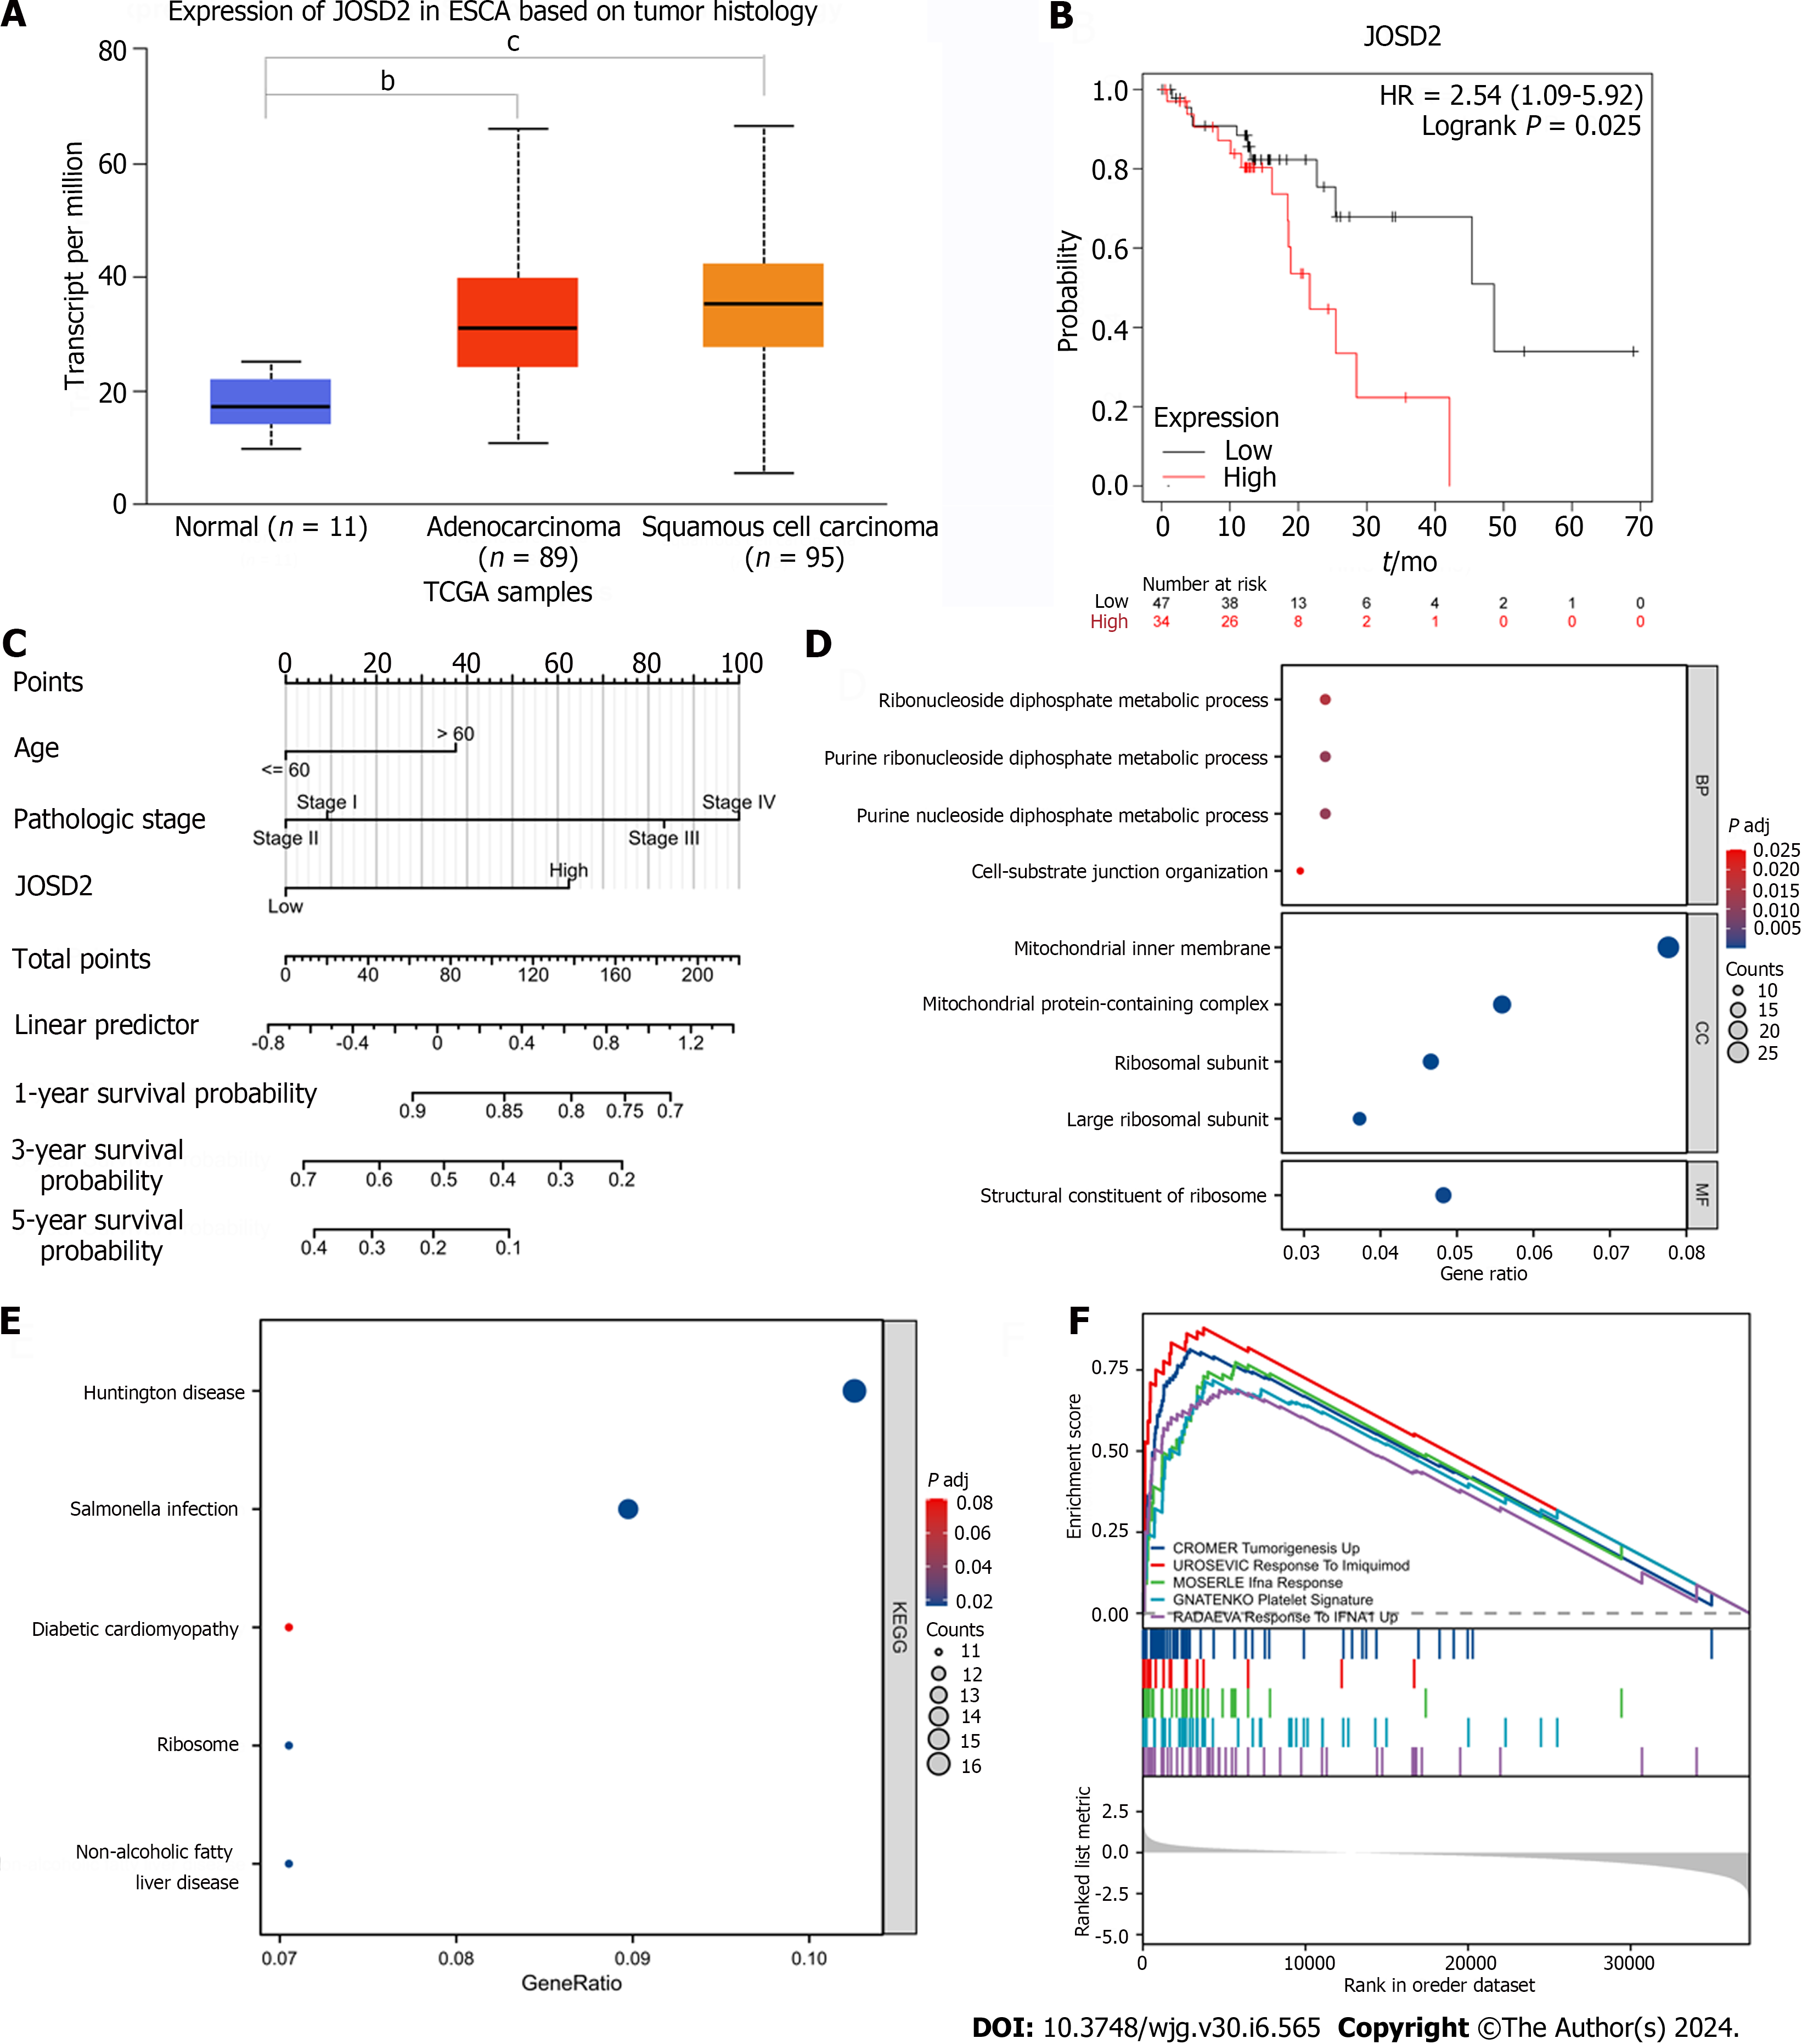
Figure 1 Expression level, survival analysis, and enrichment analyses of JOSD2 in esophageal squamous cell carcinoma tissues.
A: Boxplots of JOSD2 expression in esophageal squamous cell carcinoma (ESCC) tissues and normal esophageal tissues based on University of Alabama at Birmingham CANcer database; B: Kaplan-Meier plot showing the survival difference between ESCC patients with high vs low JOSD2 expression based on the Kaplan-Meier Plotter database; C: Nomogram of JOSD2 expression predicting 1-, 3- and 5-year survival probability of ESCC patients; D-F: Gene Ontology (D), Kyoto Encyclopedia of Genes and Genomes (E) and Gene Set Enrichment Analysis (F) enrichment analyses of JOSD2. bP < 0.001; cP < 0.0001.
- Citation: Wang WP, Shi D, Yun D, Hu J, Wang JF, Liu J, Yang YP, Li MR, Wang JF, Kong DL. Role of deubiquitinase JOSD2 in the pathogenesis of esophageal squamous cell carcinoma. World J Gastroenterol 2024; 30(6): 565-578
- URL: https://www.wjgnet.com/1007-9327/full/v30/i6/565.htm
- DOI: https://dx.doi.org/10.3748/wjg.v30.i6.565


