Copyright
©The Author(s) 2024.
World J Gastroenterol. Feb 14, 2024; 30(6): 542-555
Published online Feb 14, 2024. doi: 10.3748/wjg.v30.i6.542
Published online Feb 14, 2024. doi: 10.3748/wjg.v30.i6.542
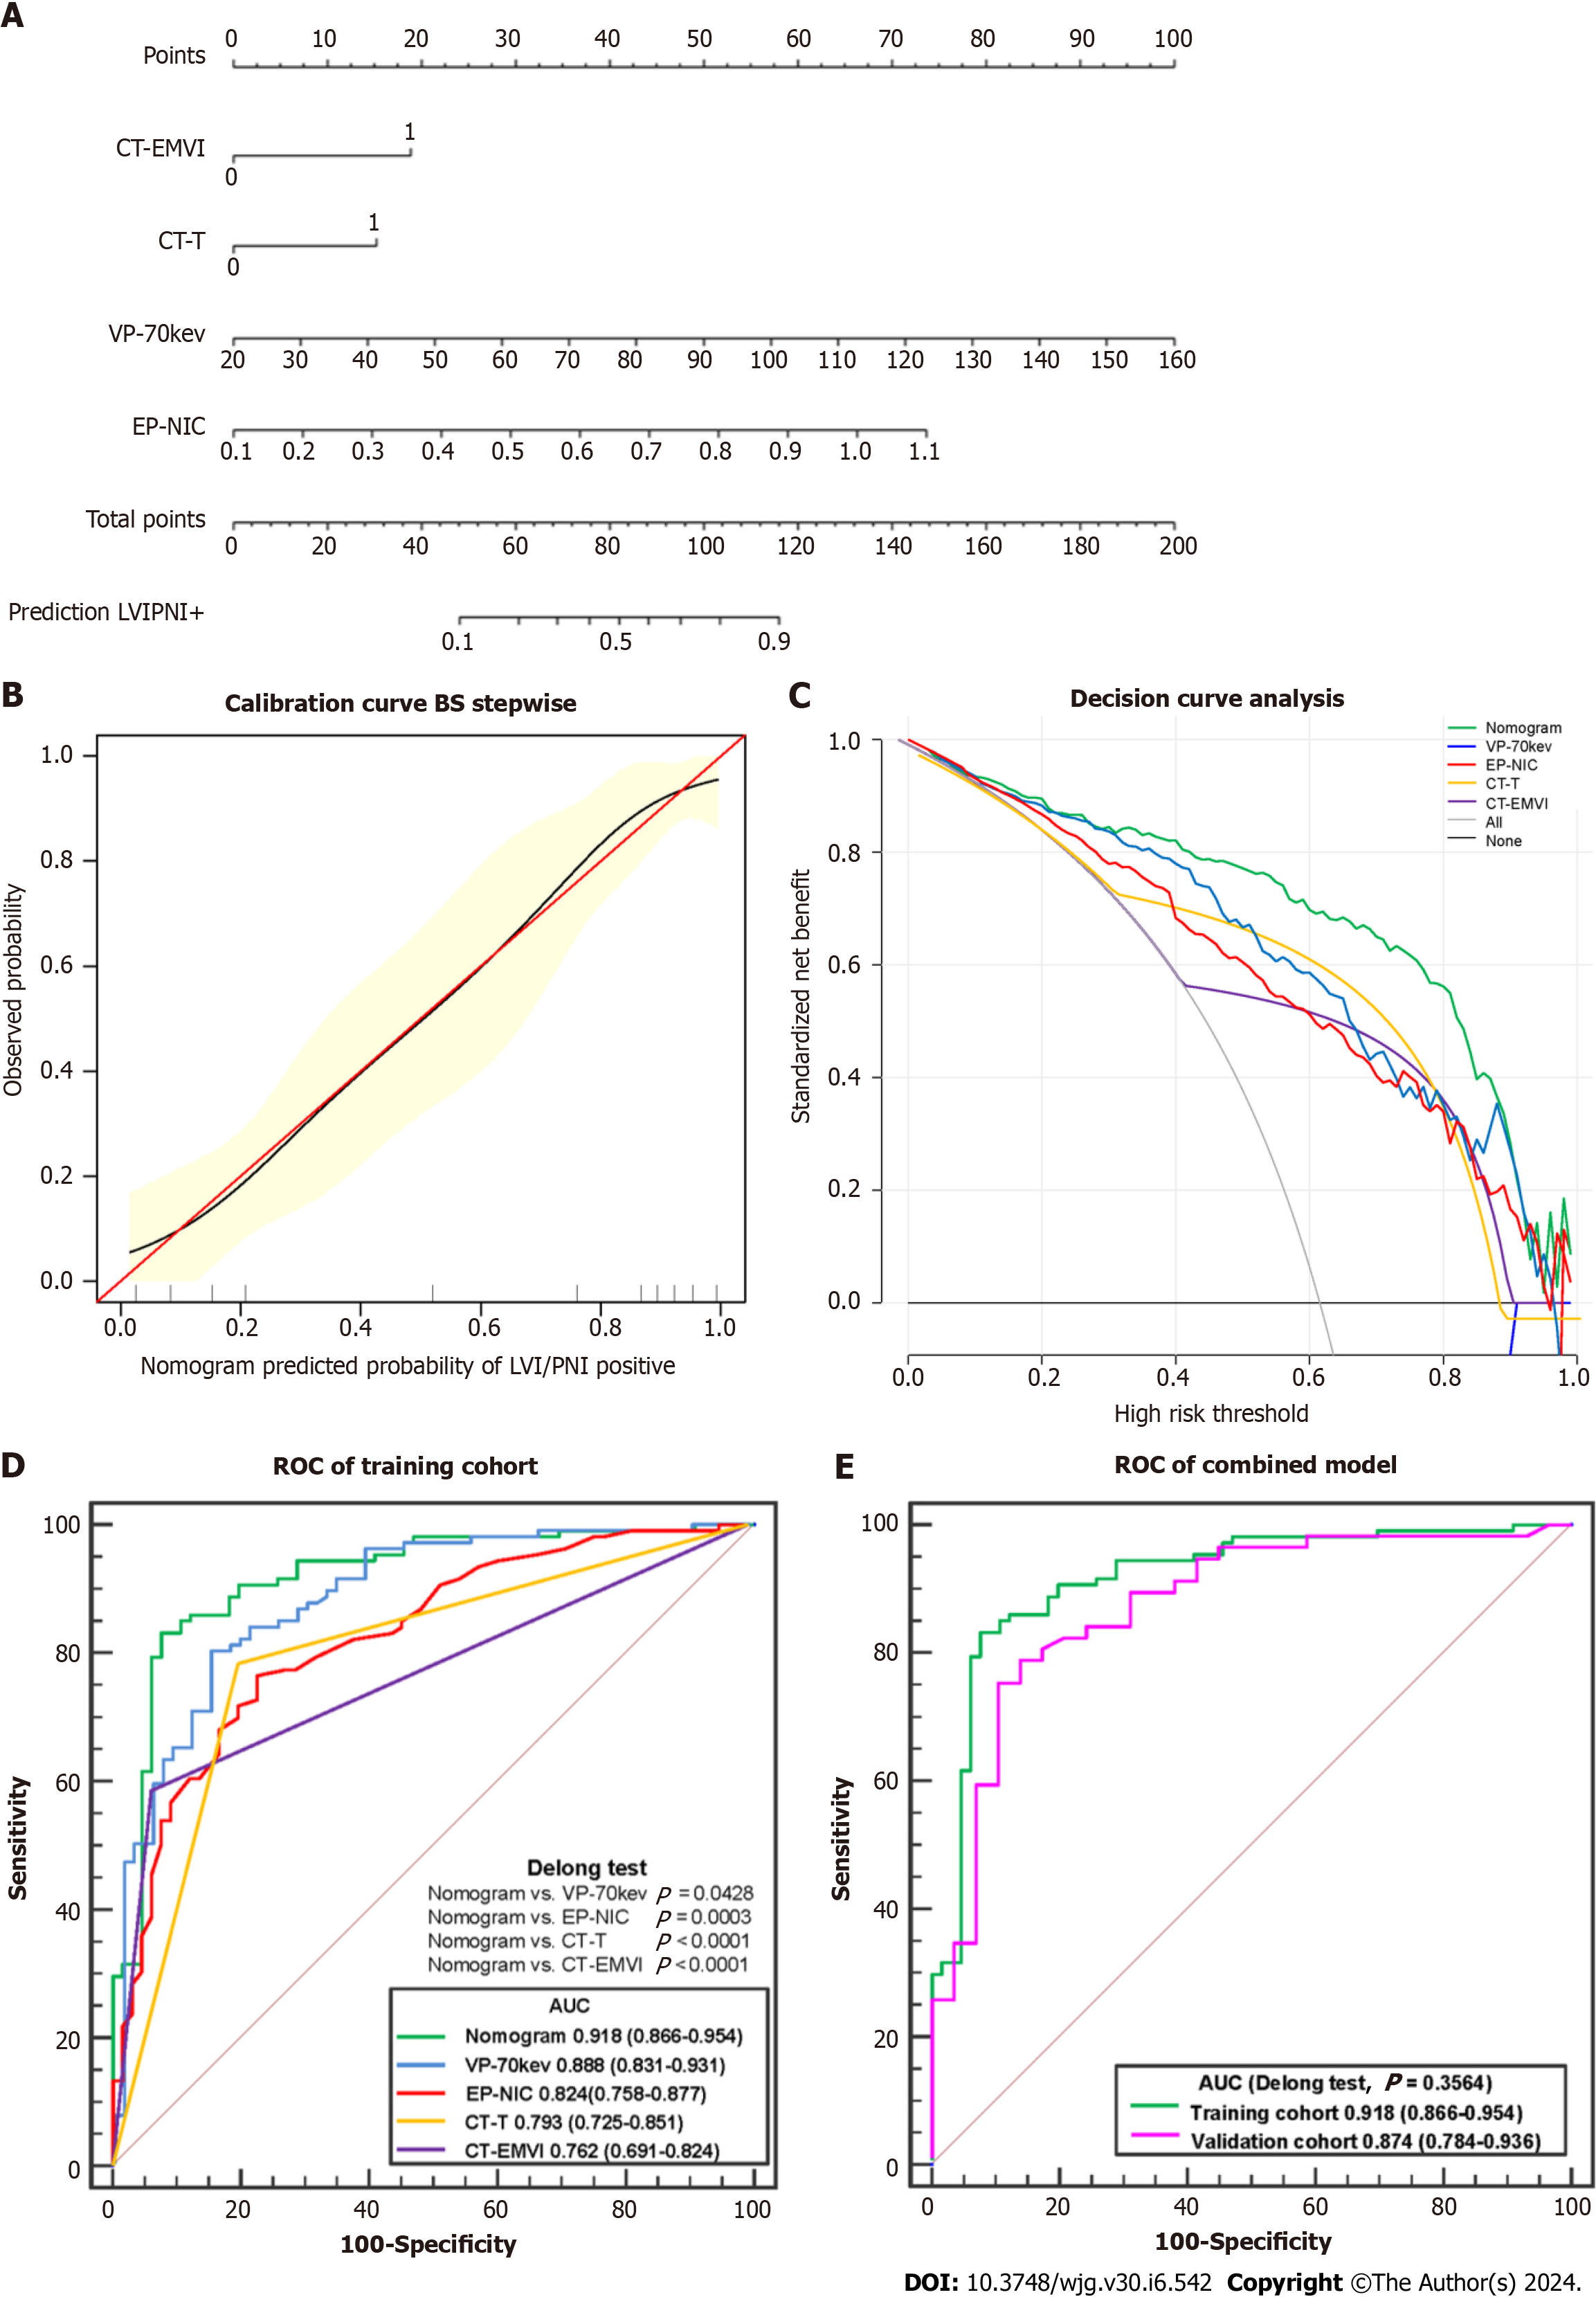
Figure 6 Comprehensive analysis of predictive models.
A: Individual nomogram; B: Calibration curve; C: Decision curve analysis of the training cohort; D: Receiver operating characteristic (ROC) curves of the application of the nomogram, VP-70 keV, EP-NIC, CT-T and CT-EMVI to the training cohort. The DeLong test showed that the differences were significant between the nomogram and each single independent factor; E: ROC curve of the application of the nomogram to the training cohort and the validation cohort. CT-EMVI: Computed tomography-detected extramural vein invasion; VP-70 keV: Single-energy computed tomography value of 70 keV in the venous phase; EP-NIC: Ratio of the standardized iodine concentration in the equilibrium phase; ROC: Receiver operating characteristic; AUC: Area under the receiver operating characteristic curve.
- Citation: Ge HT, Chen JW, Wang LL, Zou TX, Zheng B, Liu YF, Xue YJ, Lin WW. Preoperative prediction of lymphovascular and perineural invasion in gastric cancer using spectral computed tomography imaging and machine learning. World J Gastroenterol 2024; 30(6): 542-555
- URL: https://www.wjgnet.com/1007-9327/full/v30/i6/542.htm
- DOI: https://dx.doi.org/10.3748/wjg.v30.i6.542


