Retrospective Study
Copyright ©The Author(s) 2024.
World J Gastroenterol. Feb 14, 2024; 30(6): 542-555
Published online Feb 14, 2024. doi: 10.3748/wjg.v30.i6.542
Figure 5
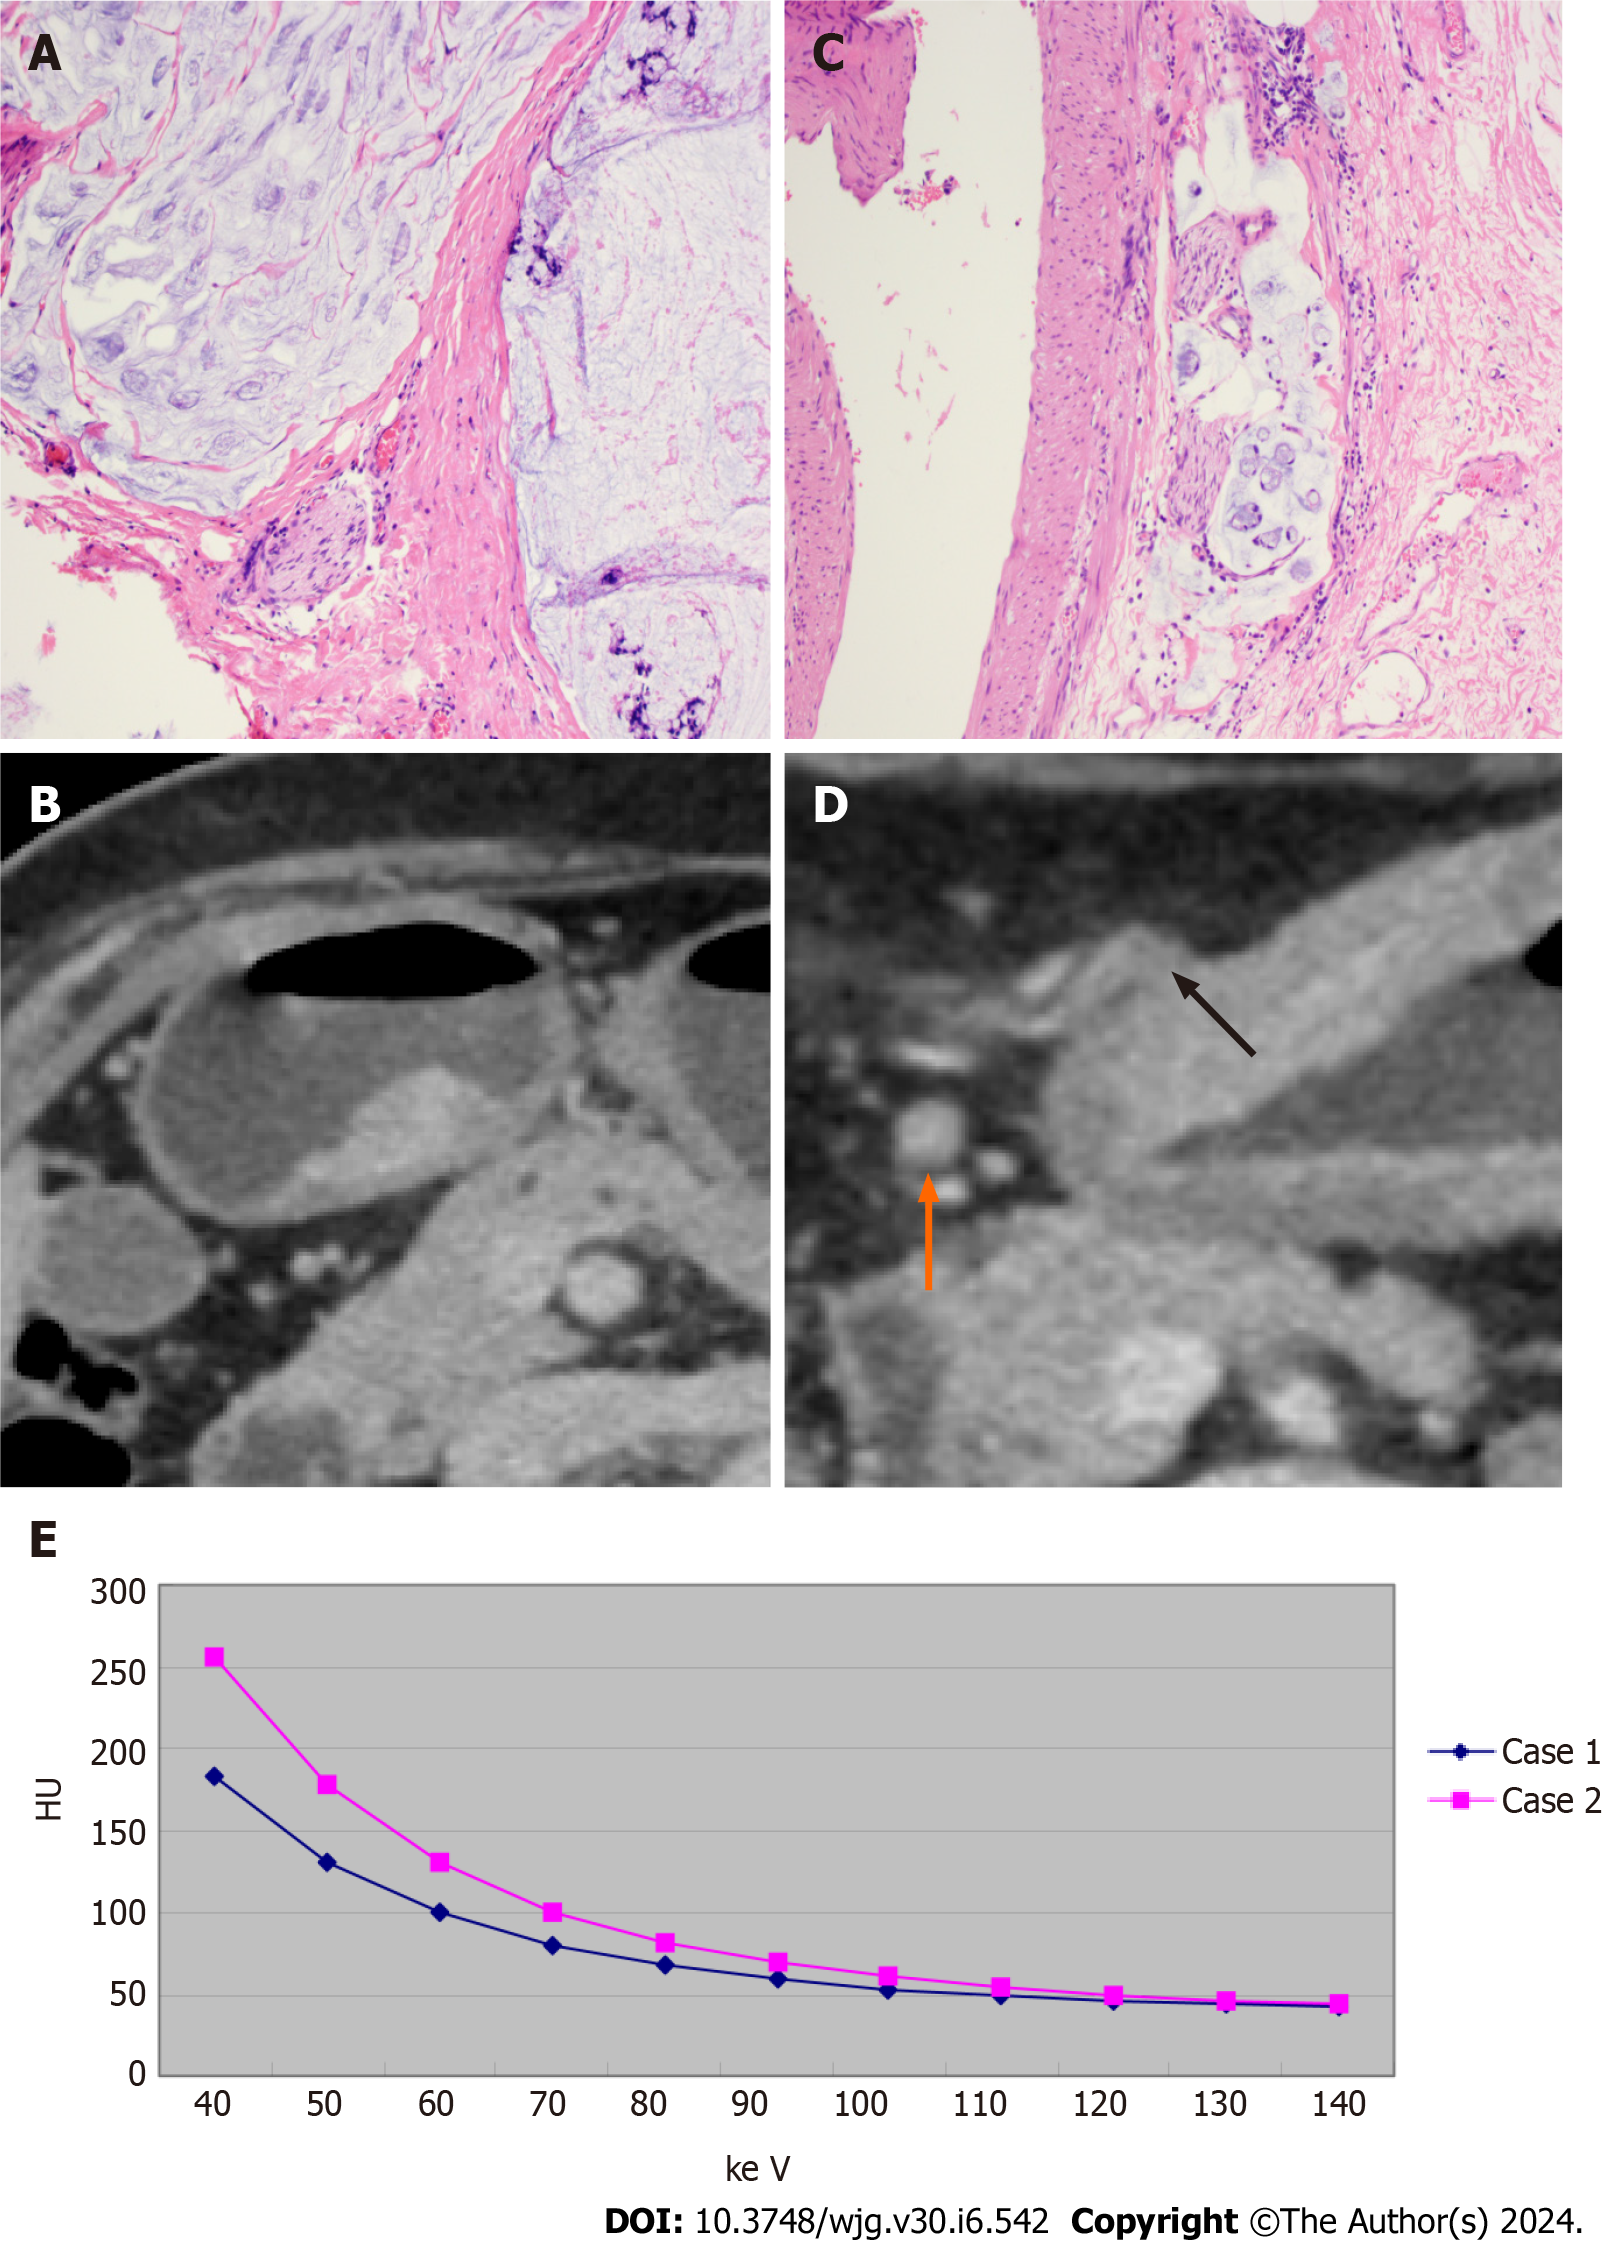
Figure 5 Comparative imaging and spectral analysis of pathological gastric adenocarcinoma in two patients with different lymphovascular and perineural invasion status. A and B: Patient 1: The patient was a 75-year-old female with pathological gastric adenocarcinoma, and both lymphovascular invasion (LVI) and perineural invasion (PNI) were negative (HE, × 200); the equilibrium phase (EP) transverse view shows that the gastric cancer (GC) lesion was immersed in the submucosal low-density layer, and the infiltration depth was more than 50% of the lesion; however, the low-density zone was still visible with an intact outer membrane. No suspicious metastatic lymph nodes were found on the computed tomography (CT) image, and no extramural blood vessels were found around the lesion. The CT stage was CT-T2N0, and CT-detected extramural vein invasion (CT-EMVI) was 0 and negative. The slopes of the energy spectrum curves in the EP were K40-70 = 3.43, IC = 18.46 (100 μg/cm3), normalized iodine concentration (NIC) = 0.40, and effective atomic number (Zeff) = 8.68; C and D: Patient 2: The patient was a 77-year-old male with pathological gastric adenocarcinoma, and both LVI and PNI were positive (HE, × 200). The GC lesion in the transverse position in the equilibrium stage permeated the gastric wall, and a cord-like thickened vascular shadow was observed in the fat space around the lesion. An endovascular low-density filling defect (black arrow) was observed. Enlarged lymph nodes were observed around the lesion, the short diameter was 7 mm (orange arrow), the CT stage was CT-T4aN1, and the CT-EMVI score was 4, indicating positivity. The slopes of the energy spectrum curves in the EP are K40-70 = 5.18, IC = 27.41 (100 μg/cm3), NIC = 0.59, and Zeff = 9.14; E: The energy spectrum curve shows that the CT value at 40-140 keV in patient 2 is greater than that in patient 1, and the value of the slope is greater. The spectral parameters of patient 2 are greater than those of patient 1.