Copyright
©The Author(s) 2024.
World J Gastroenterol. Feb 14, 2024; 30(6): 542-555
Published online Feb 14, 2024. doi: 10.3748/wjg.v30.i6.542
Published online Feb 14, 2024. doi: 10.3748/wjg.v30.i6.542
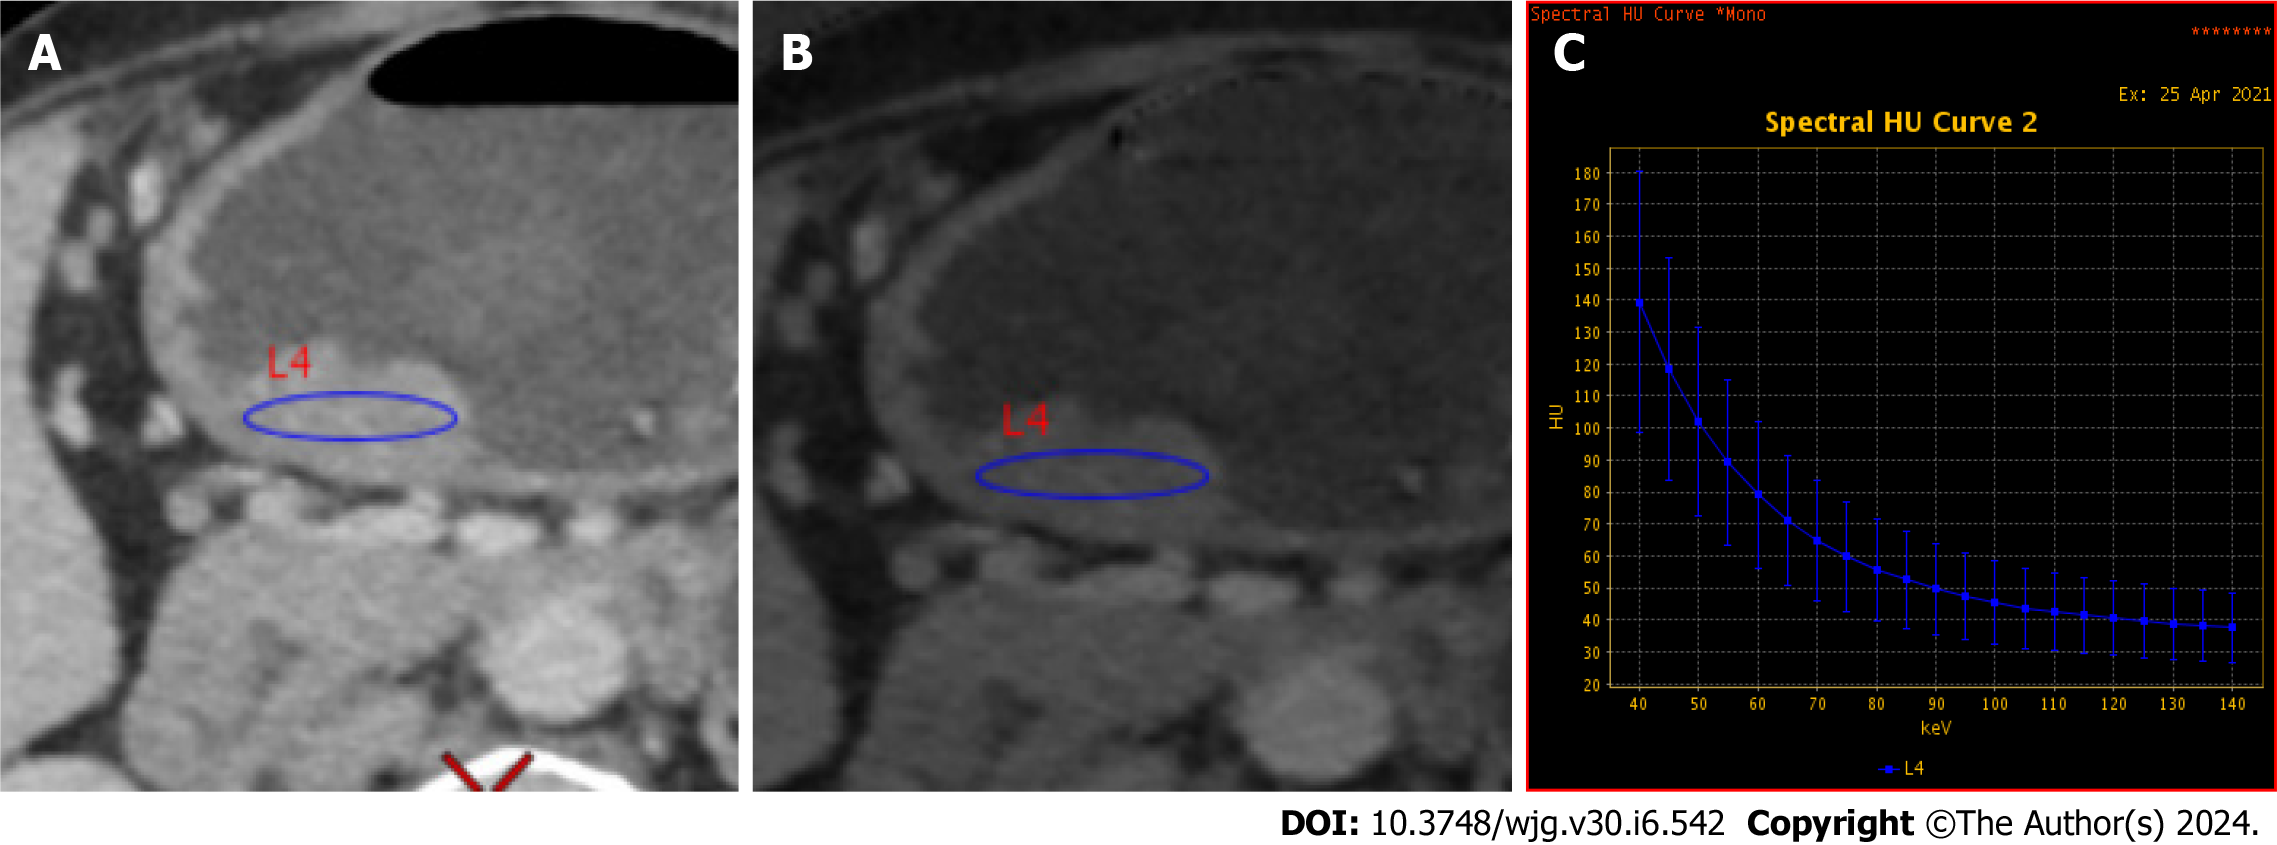
Figure 3 Example of the energy spectrum data measurement.
A: 70 keV single-energy image; B: The iodine base image; C: The energy spectrum curve. Elliptical regions of interests were drawn at the largest level of the lesion in the lesser curvature of the gastric horn, as shown in A and B.
- Citation: Ge HT, Chen JW, Wang LL, Zou TX, Zheng B, Liu YF, Xue YJ, Lin WW. Preoperative prediction of lymphovascular and perineural invasion in gastric cancer using spectral computed tomography imaging and machine learning. World J Gastroenterol 2024; 30(6): 542-555
- URL: https://www.wjgnet.com/1007-9327/full/v30/i6/542.htm
- DOI: https://dx.doi.org/10.3748/wjg.v30.i6.542


