Copyright
©The Author(s) 2024.
World J Gastroenterol. Dec 21, 2024; 30(47): 5032-5054
Published online Dec 21, 2024. doi: 10.3748/wjg.v30.i47.5032
Published online Dec 21, 2024. doi: 10.3748/wjg.v30.i47.5032
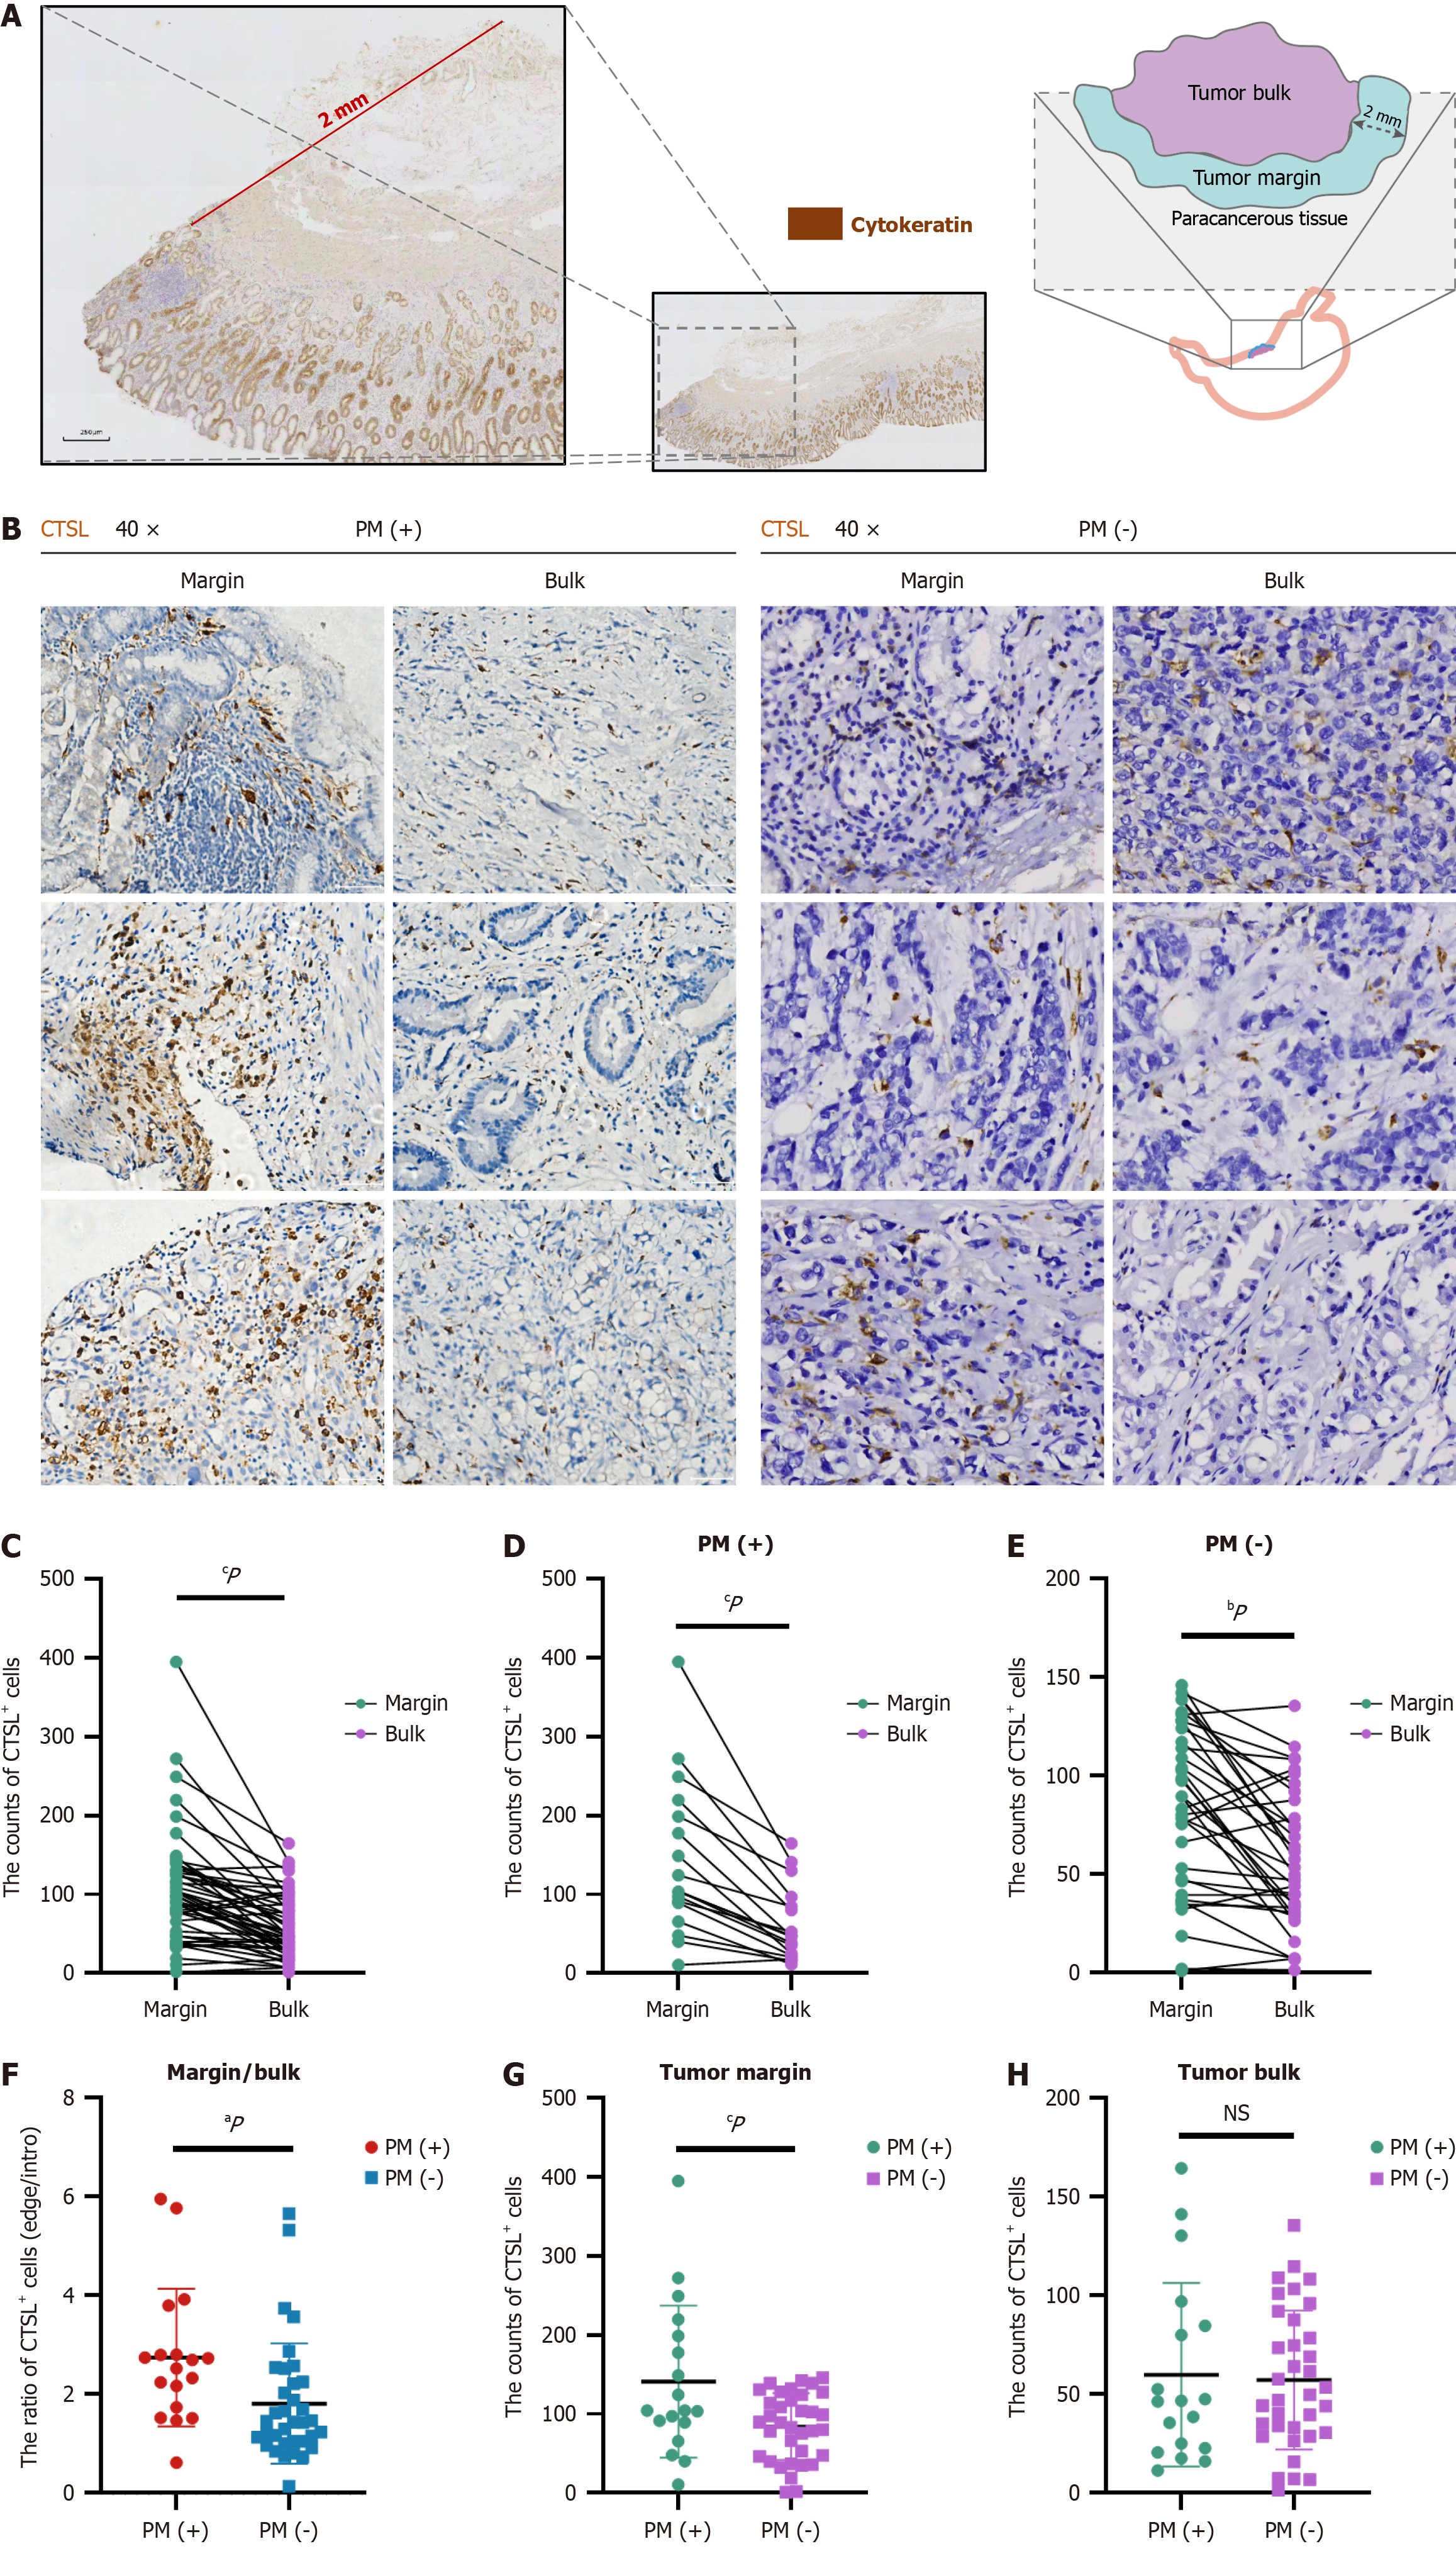
Figure 2 Cathepsin L is more localized in the gastric tumor margin than in the bulk.
A: Example diagram of the method for classifying tumor sections stained for cytokeratin, which defines the 2-mm-wide area away from the edge of the tumor as the tumor margin; scale bar, 500 μm; B-E: Representative immunohistochemistry images of the margin and bulk of each tumor section from patients with or without peritoneal metastasis stained for cathepsin L; scale bar, 50 μm. The number of positive cells in the tumor sections was quantified via Image J via the geometric mean of 3 representative views from each section. The data points are presented as the means ± SD. The error bars represent the SD; cP < 0.001; bP < 0.01 according to Student’s t test; F-H: Significant analysis of positive cell counts according to the metastasis state in the tumor margin or bulk region by Image J via the geometric mean of 3 representative views from each section. The data points are presented as the means ± SD. The error bars represent the SD; NS: Not significant, P > 0.05; aP < 0.05; cP < 0.001 according to Student’s t test. CTSL: Cathepsin L; PM: Peritoneal metastasis.
- Citation: Xiao LX, Li XJ, Yu HY, Qiu RJ, Zhai ZY, Ding WF, Zhu MS, Zhong W, Fang CF, Yang J, Chen T, Yu J. Macrophage-derived cathepsin L promotes epithelial-mesenchymal transition and M2 polarization in gastric cancer. World J Gastroenterol 2024; 30(47): 5032-5054
- URL: https://www.wjgnet.com/1007-9327/full/v30/i47/5032.htm
- DOI: https://dx.doi.org/10.3748/wjg.v30.i47.5032


