Copyright
©The Author(s) 2024.
World J Gastroenterol. Dec 14, 2024; 30(46): 4929-4936
Published online Dec 14, 2024. doi: 10.3748/wjg.v30.i46.4929
Published online Dec 14, 2024. doi: 10.3748/wjg.v30.i46.4929
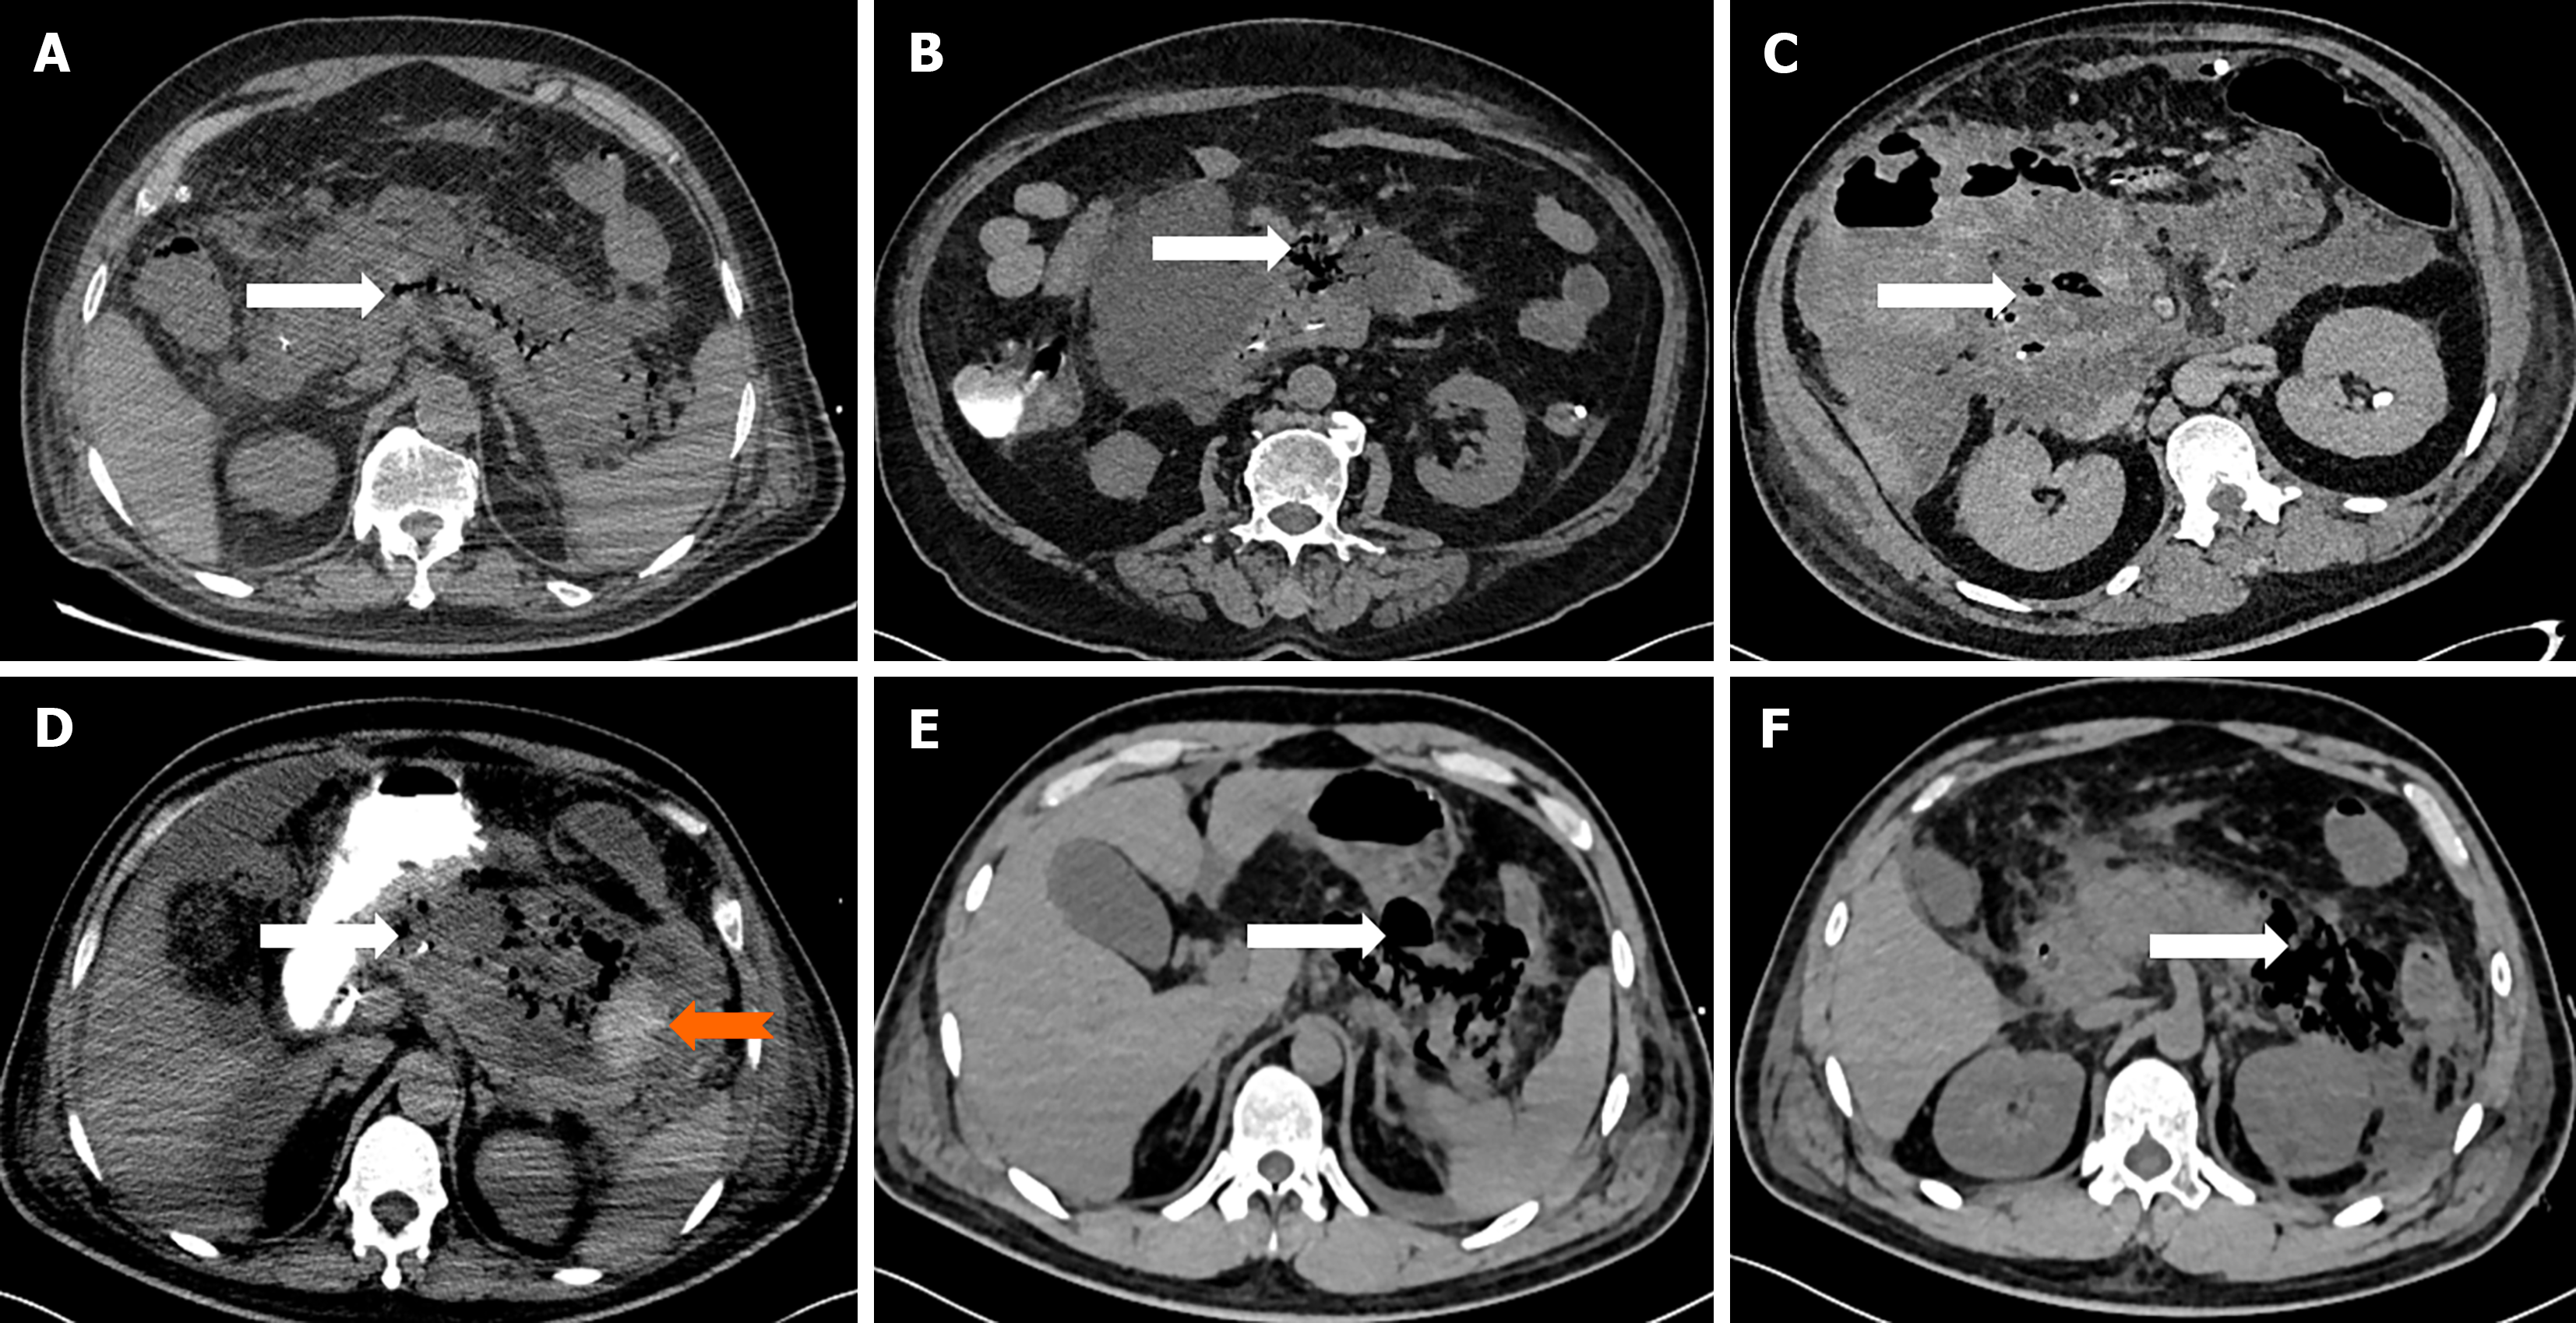
Figure 2 Computed tomography imaging findings in patients with hyperematous pancreatitis.
A: Computed tomography (CT) scan showing gas confined to the pancreatic parenchyma (white arrow) with pancreatic swelling; B: Gas confined to the body of the pancreas (white arrow) with significant swelling of the pancreatic head; C: Gas confined to the pancreatic head (white arrow) with multiple gas cavities and exudate involving the right hepatorenal space; D: Gas confined to the body and tail of the pancreas (orange arrow) with haemorrhage in the pancreatic tail (broad white arrow) and exudate involving the perisplenic and perirenal areas; E: Gas confined to the body and tail of the pancreas with larger gas cavities (white arrow); F: Gas confined to the tail of the pancreas with larger gas cavities (white arrow) and exudate involving the anterior fascia of the left kidney.
- Citation: Cao LJ, Lu ZH, Zhang PJ, Yang X, Yu WL, Sun Y. Emphysematous pancreatitis: Diagnosis, treatment, and prognosis. World J Gastroenterol 2024; 30(46): 4929-4936
- URL: https://www.wjgnet.com/1007-9327/full/v30/i46/4929.htm
- DOI: https://dx.doi.org/10.3748/wjg.v30.i46.4929


