Copyright
©The Author(s) 2024.
World J Gastroenterol. Dec 7, 2024; 30(45): 4817-4835
Published online Dec 7, 2024. doi: 10.3748/wjg.v30.i45.4817
Published online Dec 7, 2024. doi: 10.3748/wjg.v30.i45.4817
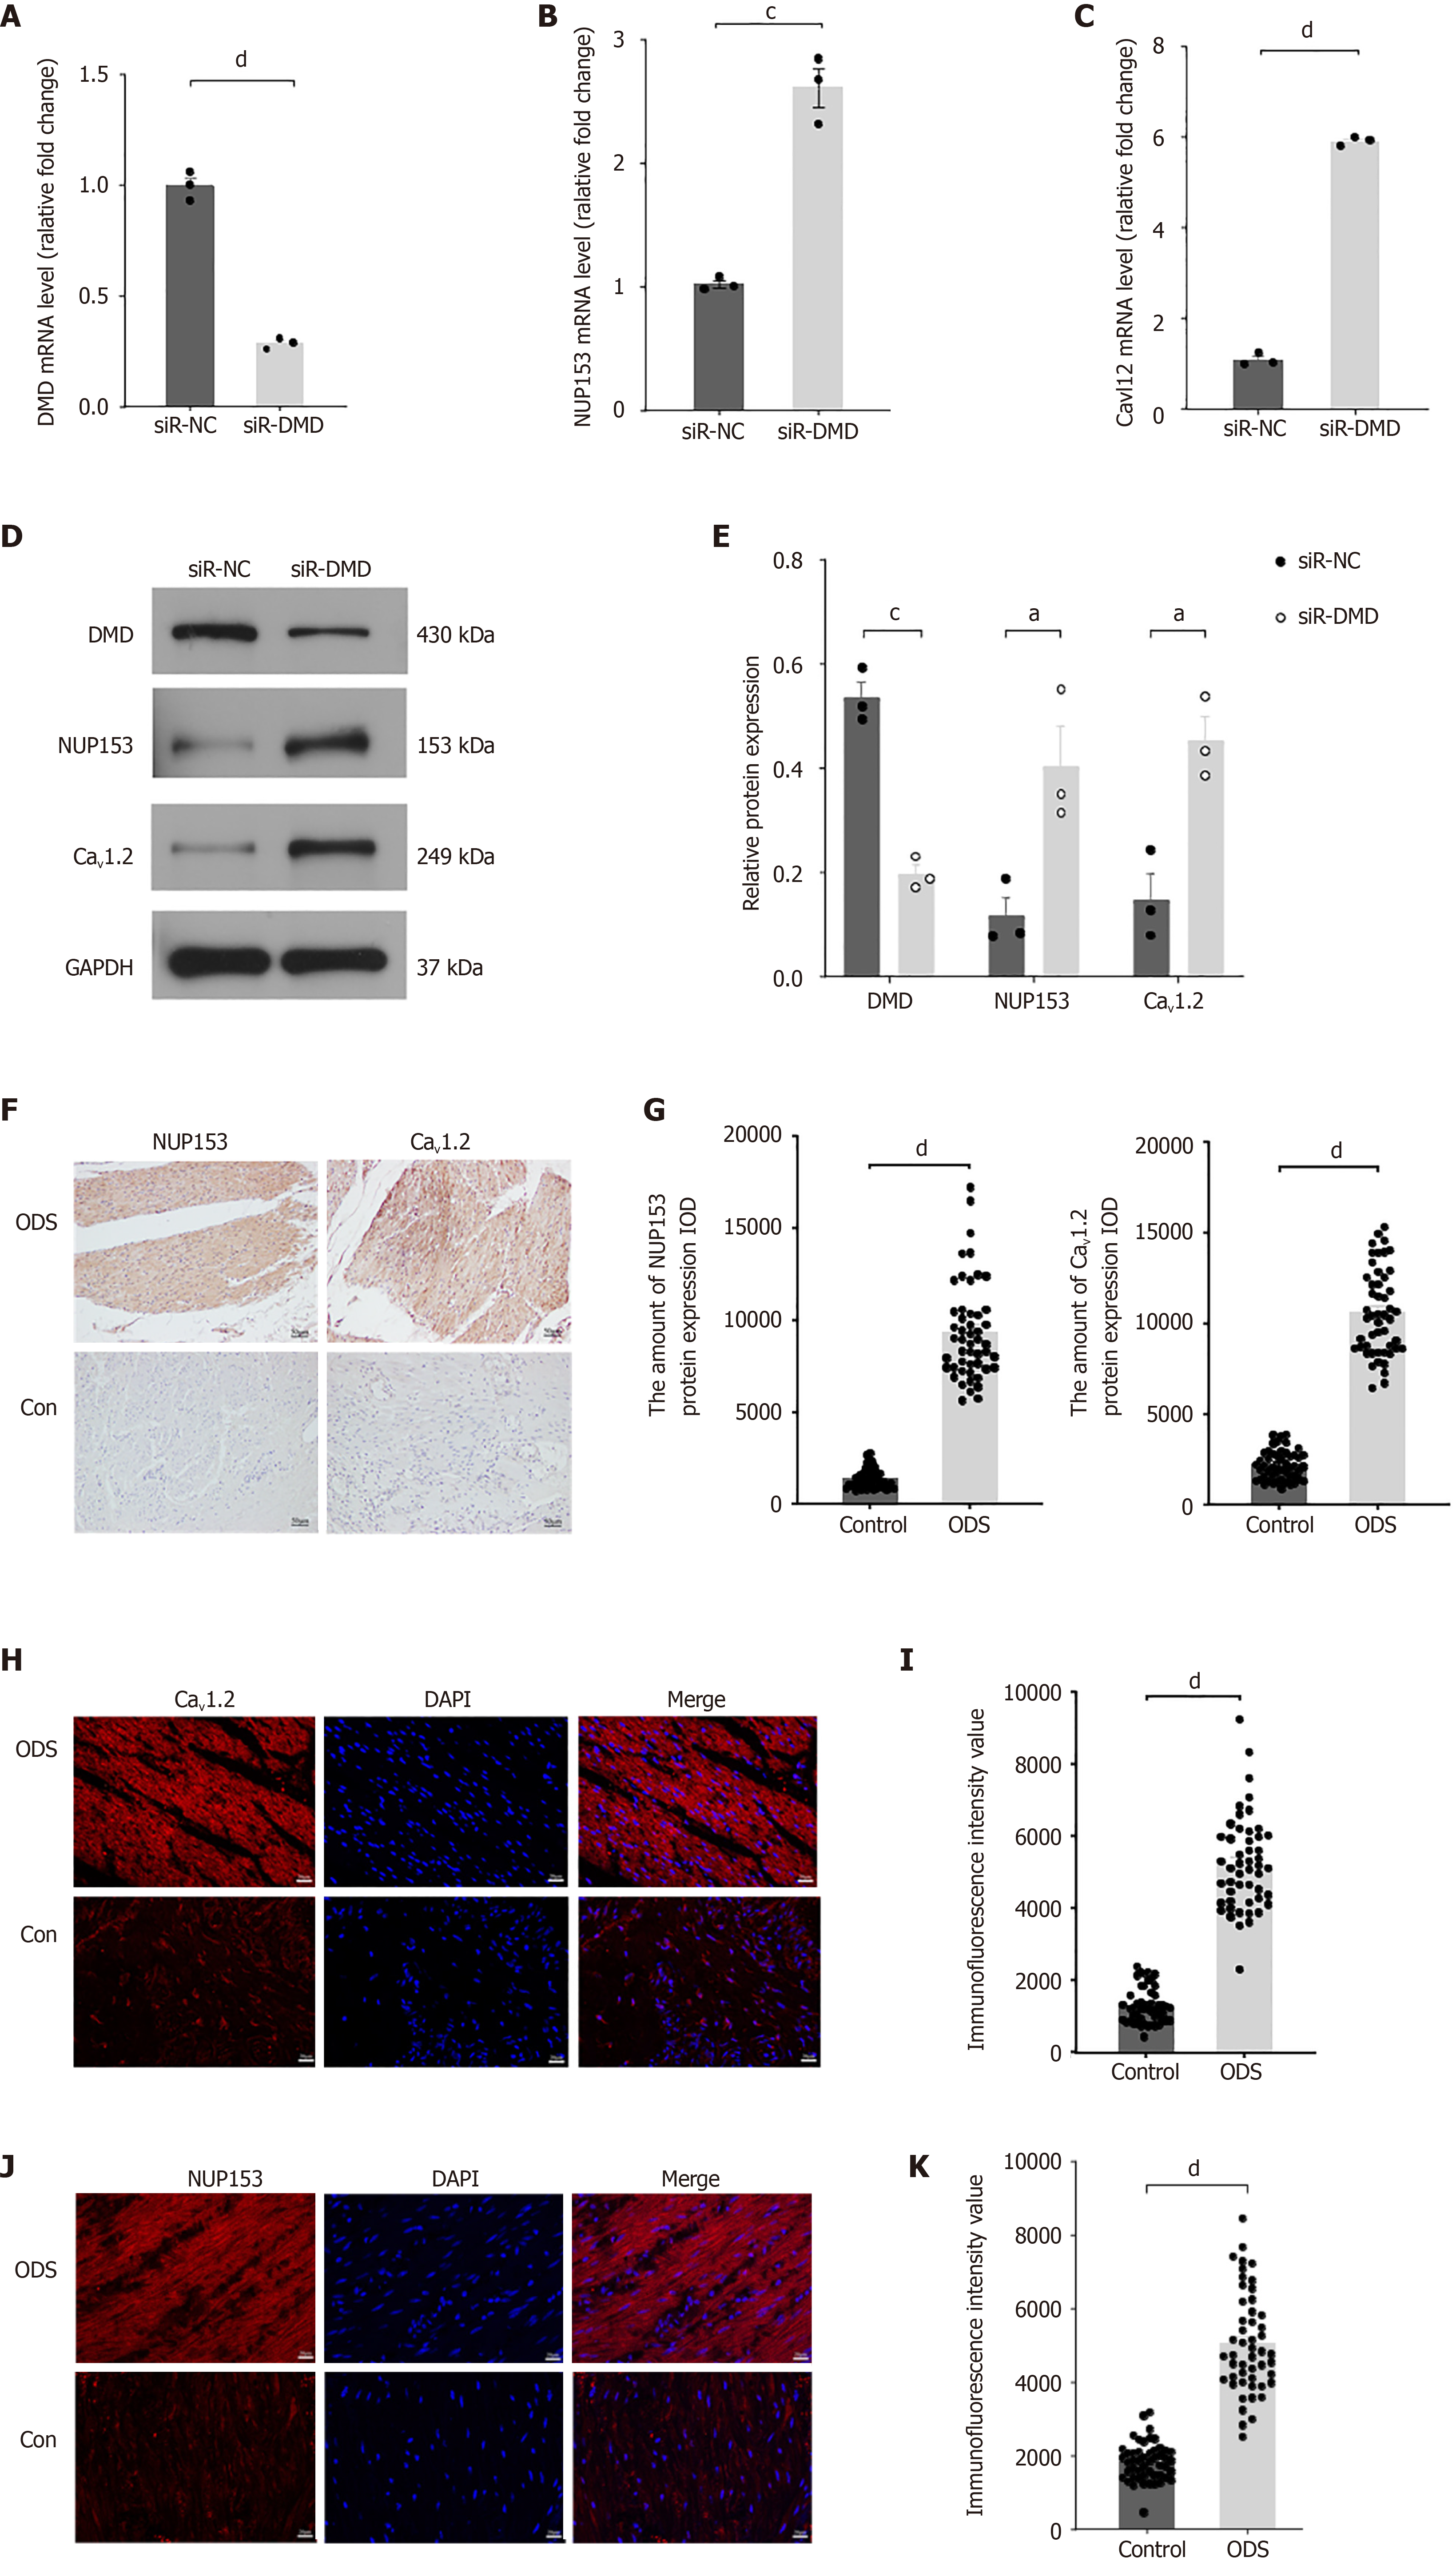
Figure 4 Overexpression of nucleoporin protein 153 and L-type voltage-gated calcium channel is associated with downregulation of dystrophin expression in human intestinal smooth muscle cells.
A: Real-time quantitative polymerase chain reaction (RT-qPCR) was used to detect the expression of dystrophin (DMD) in human intestinal smooth muscle cells transfected with negative control small interfering RNA (siR-NC) or siR-dystrophin (siR-DMD); B: RT-qPCR was used to detect the expression of nucleoporin protein 153 (NUP153) in human intestinal smooth muscle cells transfected with siR-NC or siR-DMD; C: RT-qPCR was used to detect the expression of L-type voltage-gated calcium channel (Cav1.2) in human intestinal smooth muscle cells transfected with siR-NC or siR-DMD; D: Western blot analysis of the levels of DMD, NUP153, and Cav1.2 in human intestinal smooth muscle cells transfected with siR-NC or siR-DMD; E: Quantitative analysis of Western blot greyscale value; F: Representative immunohistochemistry staining for NUP153 and Cav1.2 in rectal specimens from two groups of 50 cases. Scale bar = 50 μm; G: Quantitative analysis of the immunohistochemistry expression of NUP153 and Cav1.2 (integrated optical density of NUP153 and Cav1.2) in rectum samples of the obstructed defecation syndrome (ODS) group compared with the control group; H: Representative immunofluorescence staining for NUP153 in rectal specimens from two groups of 50 cases. Scale bar = 20 μm. Nuclei were counterstained with DAPI; I: Quantitative analysis of mean fluorescence intensity of NUP153 relative to the ODS and control groups; J: Representative immunofluorescence staining for Cav1.2 in rectal specimens from two groups of 50 cases. Scale bar = 20 μm. Nuclei were counterstained with DAPI; K: Quantitative analysis of mean fluorescence intensity of Cav1.2 relative to the ODS and control groups. aP < 0.05, cP < 0.001, dP < 0.0001, n = 3. siR-NC: Negative control small interfering RNA; siR-DMD: Dystrophin small interfering RNA; DMD: Dystrophin; ODS: Obstructed defecation syndrome; NUP153: Nucleoporin protein 153; Cav1.2: L-type voltage-gated calcium channel.
- Citation: Li WZ, Xiong Y, Wang TK, Chen YY, Wan SL, Li LY, Xu M, Tong JJ, Qian Q, Jiang CQ, Liu WC. Quantitative proteomics analysis reveals the pathogenesis of obstructed defecation syndrome caused by abnormal expression of dystrophin. World J Gastroenterol 2024; 30(45): 4817-4835
- URL: https://www.wjgnet.com/1007-9327/full/v30/i45/4817.htm
- DOI: https://dx.doi.org/10.3748/wjg.v30.i45.4817


