Copyright
©The Author(s) 2024.
World J Gastroenterol. Dec 7, 2024; 30(45): 4817-4835
Published online Dec 7, 2024. doi: 10.3748/wjg.v30.i45.4817
Published online Dec 7, 2024. doi: 10.3748/wjg.v30.i45.4817
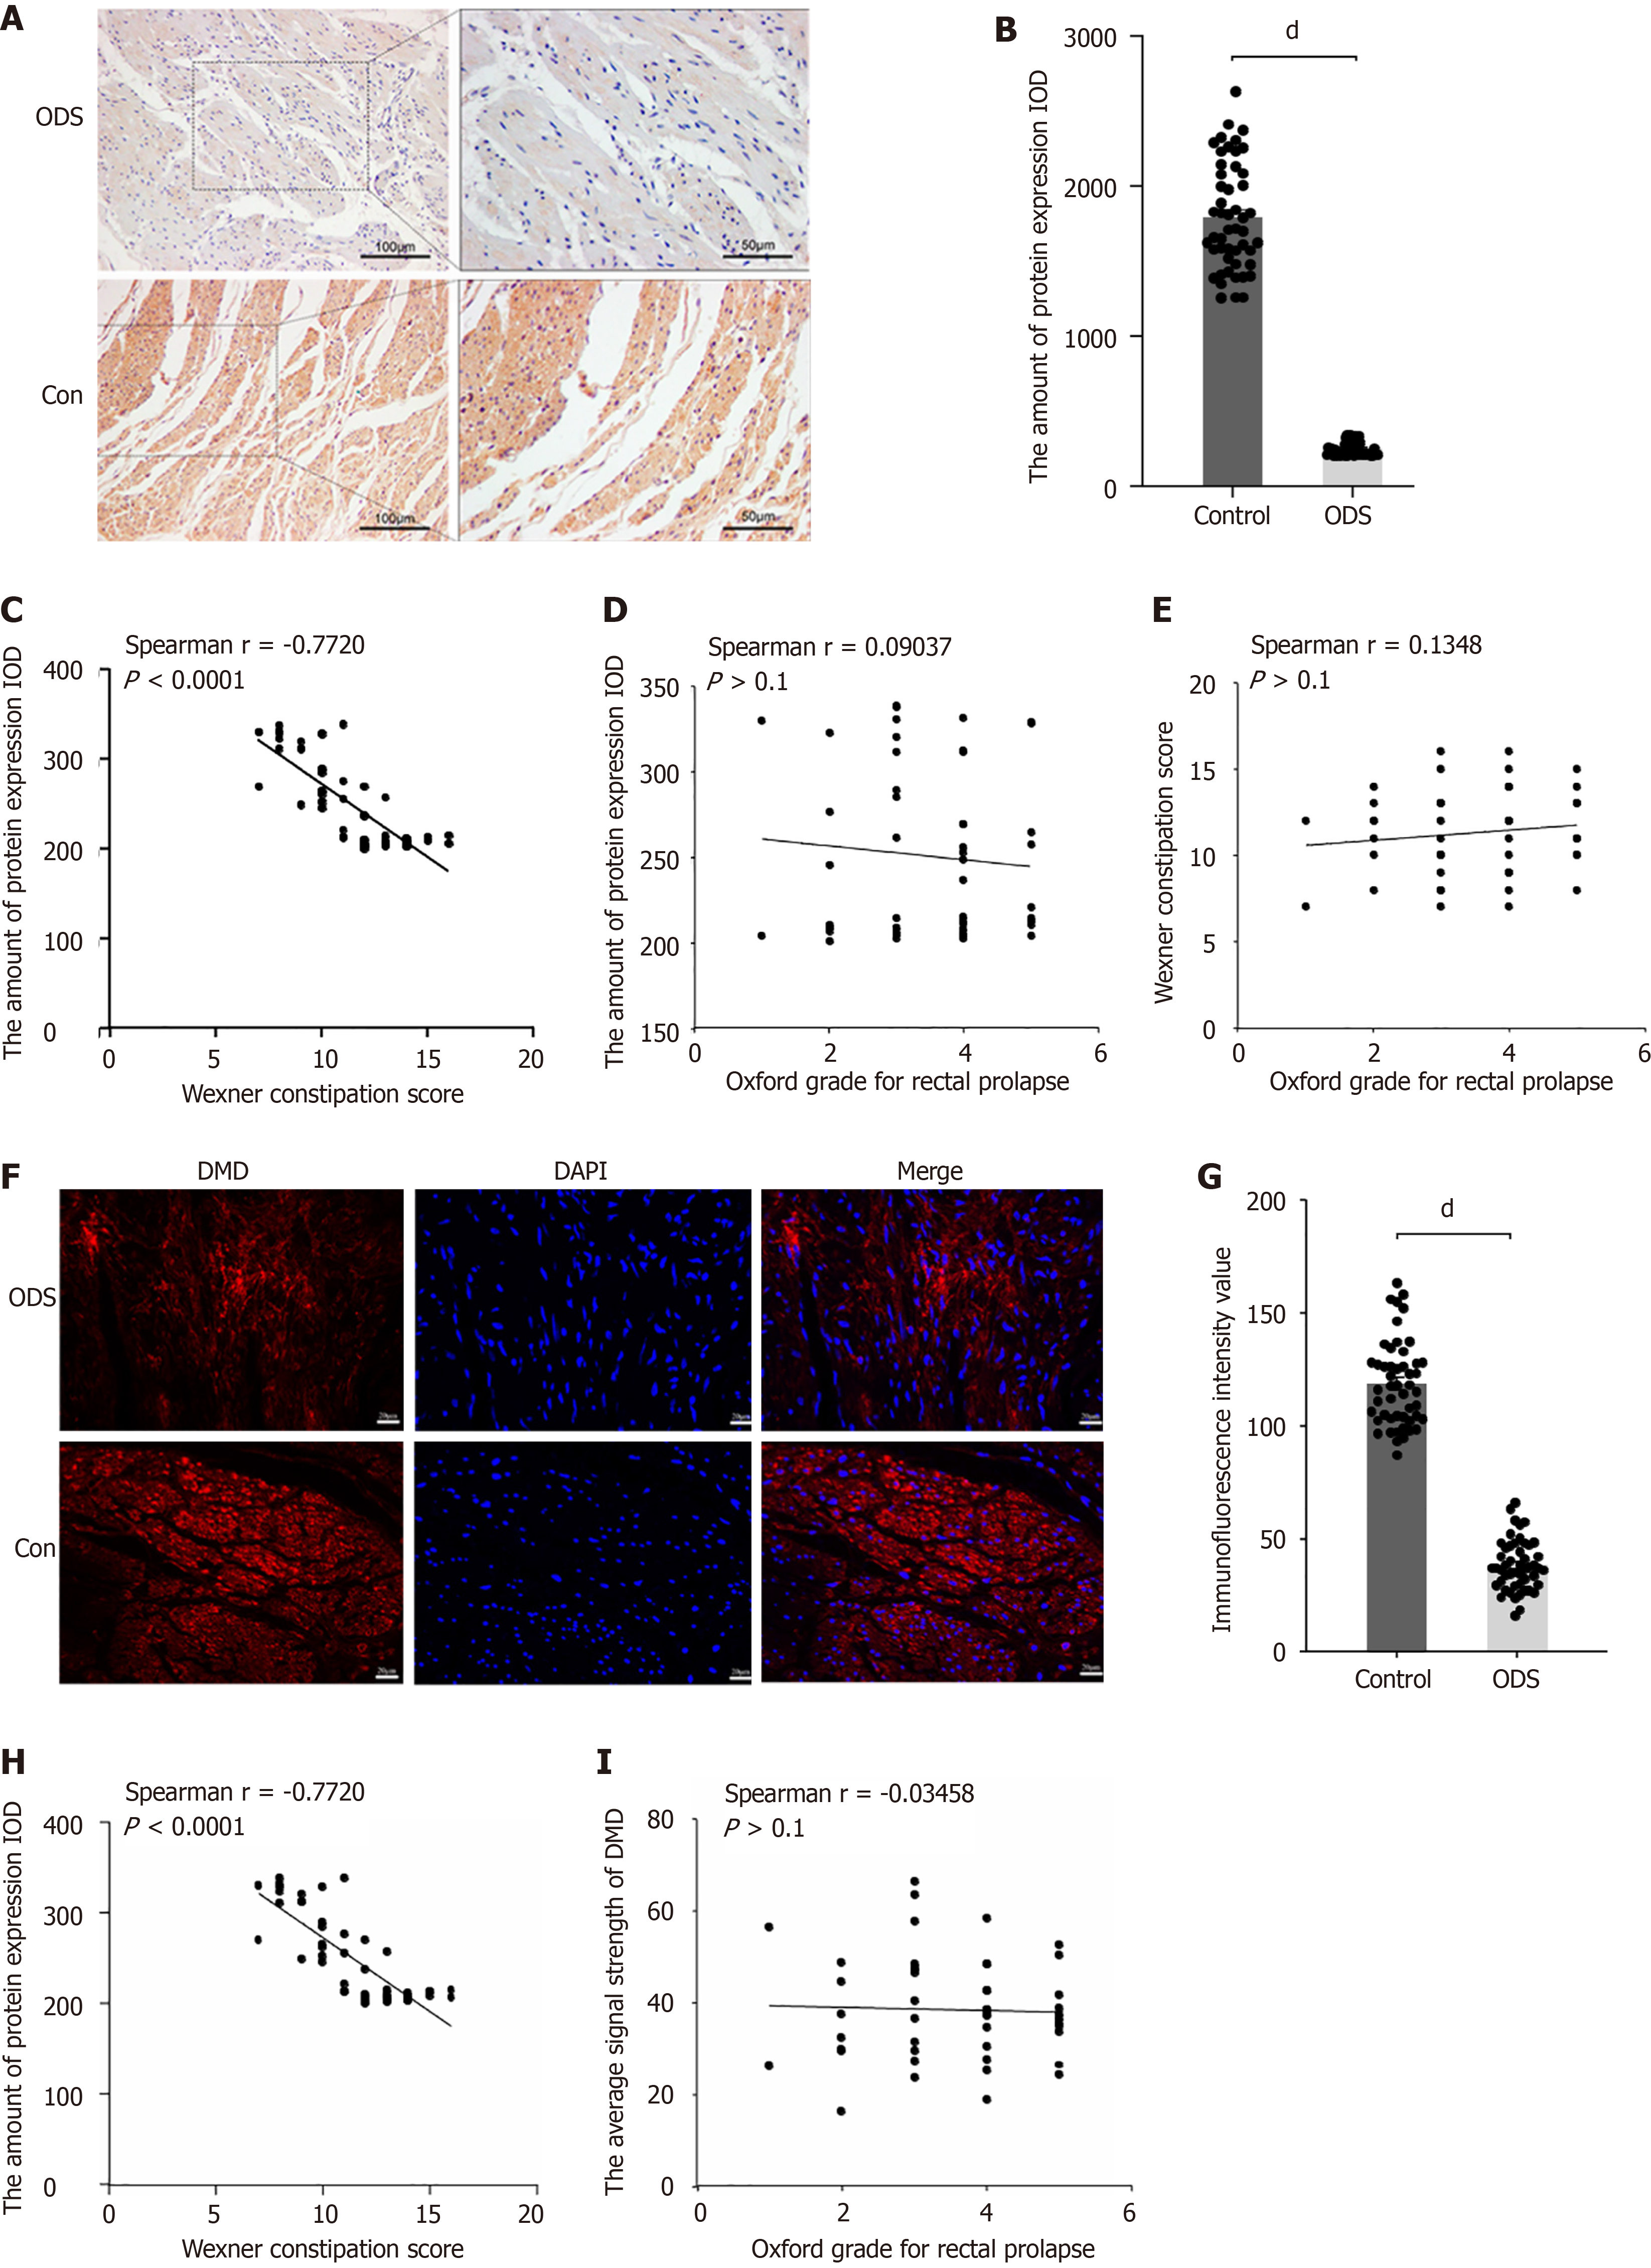
Figure 2 Downregulation of dystrophin in intestinal smooth muscle cells of obstructed defecation syndrome patients.
A: Representative immunohistochemistry staining for dystrophin (DMD) in 50 rectal specimens from both groups. Scale bar: 100 μm (left) and 50 μm (right); B: Quantitative analysis of DMD immunohistochemistry expression [integrated optical density (IOD)] in rectal samples from the obstructed defecation syndrome (ODS) group compared with the control group; C: Correlation analysis between Wexner constipation score and IOD in ODS patients. Spearman correlation r = 0.7720, P < 0.0001; D: Correlation analysis between Wexner constipation score and Oxford score in ODS patients with rectal prolapse. Spearman correlation r = 0.0904, P > 0.1; E: Correlation analysis between Wexner constipation score and IOD in ODS patients. Spearman’s correlation r = 0.1348, P > 0.1; F: Representative immunofluorescence staining for DMD in 50 rectal specimens from both groups. Scale bar = 20 μm. Nuclei were counterstained with DAPI; G: Quantitative analysis of mean fluorescence intensity (MFI) relative to the ODS and control groups; H: Correlation analysis between MFI and Wexner constipation score in the ODS group. Spearman correlation r = 0.7025, P < 0.0001; I: Correlation analysis between MFI and Oxford grade in ODS patients with rectal prolapse. Spearman correlation r = 0.03458, P > 0.1. dP < 0.0001. ODS: Obstructed defecation syndrome; IOD: Integrated optical density; DMD: Dystrophin.
- Citation: Li WZ, Xiong Y, Wang TK, Chen YY, Wan SL, Li LY, Xu M, Tong JJ, Qian Q, Jiang CQ, Liu WC. Quantitative proteomics analysis reveals the pathogenesis of obstructed defecation syndrome caused by abnormal expression of dystrophin. World J Gastroenterol 2024; 30(45): 4817-4835
- URL: https://www.wjgnet.com/1007-9327/full/v30/i45/4817.htm
- DOI: https://dx.doi.org/10.3748/wjg.v30.i45.4817


