Copyright
©The Author(s) 2024.
World J Gastroenterol. Dec 7, 2024; 30(45): 4817-4835
Published online Dec 7, 2024. doi: 10.3748/wjg.v30.i45.4817
Published online Dec 7, 2024. doi: 10.3748/wjg.v30.i45.4817
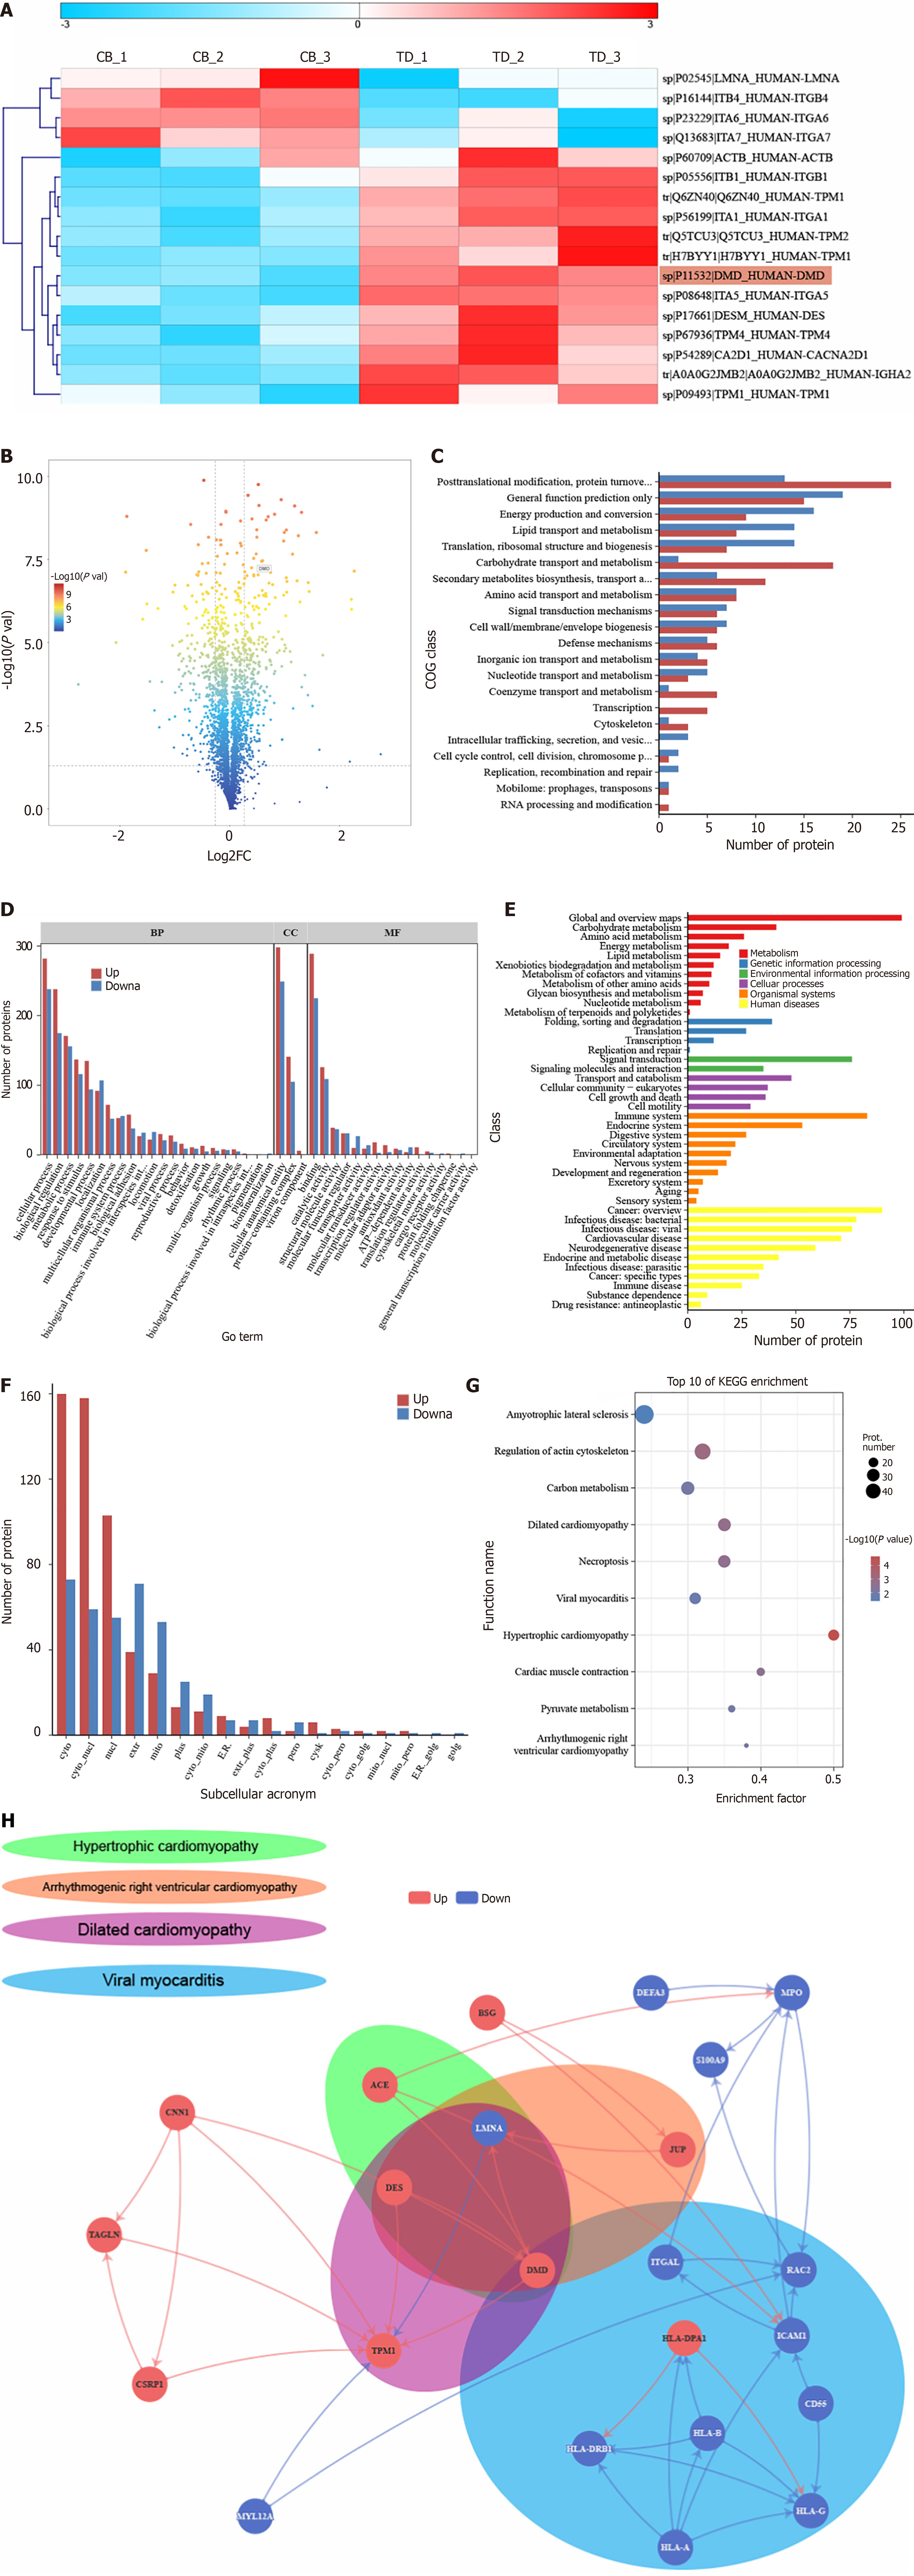
Figure 1 Analysis of differential proteins by isobaric tag for relative and absolute quantification-based quantitative proteomics.
A: Heatmap of all differential proteins in the pathological pathway of dilated cardiomyopathy; B: Volcano plot of differentially expressed proteins; C: Cluster of Orthologous Groups of proteins classification annotation results of differentially expressed proteins; D: Gene Ontology classification statistical plot of differentially expressed proteins; E: Kyoto Encyclopedia of Genes and Genomes (KEGG) classification annotation results of differentially expressed proteins; F: Subcellular localization of differentially expressed proteins; G: KEGG enrichment analysis of differentially expressed proteins. The top 10 most significantly enriched categories are shown in the bubble chart [-log10 (adjusted P value)]. The circle color indicates the enrichment P value, and the circle size indicates the number of differentially expressed proteins in the functional pathway; H: Protein interaction network of significant enrichment pathways associated with muscle contraction disorders. Red indicates up-regulated proteins expressed by the control group relative to the obstructed defecation syndrome group. Blue indicates down-regulated proteins. COG: Cluster of Orthologous Groups; GO: Gene Ontology; KEGG: Kyoto Encyclopedia of Genes and Genomes.
- Citation: Li WZ, Xiong Y, Wang TK, Chen YY, Wan SL, Li LY, Xu M, Tong JJ, Qian Q, Jiang CQ, Liu WC. Quantitative proteomics analysis reveals the pathogenesis of obstructed defecation syndrome caused by abnormal expression of dystrophin. World J Gastroenterol 2024; 30(45): 4817-4835
- URL: https://www.wjgnet.com/1007-9327/full/v30/i45/4817.htm
- DOI: https://dx.doi.org/10.3748/wjg.v30.i45.4817


