Copyright
©The Author(s) 2024.
World J Gastroenterol. Nov 28, 2024; 30(44): 4709-4724
Published online Nov 28, 2024. doi: 10.3748/wjg.v30.i44.4709
Published online Nov 28, 2024. doi: 10.3748/wjg.v30.i44.4709
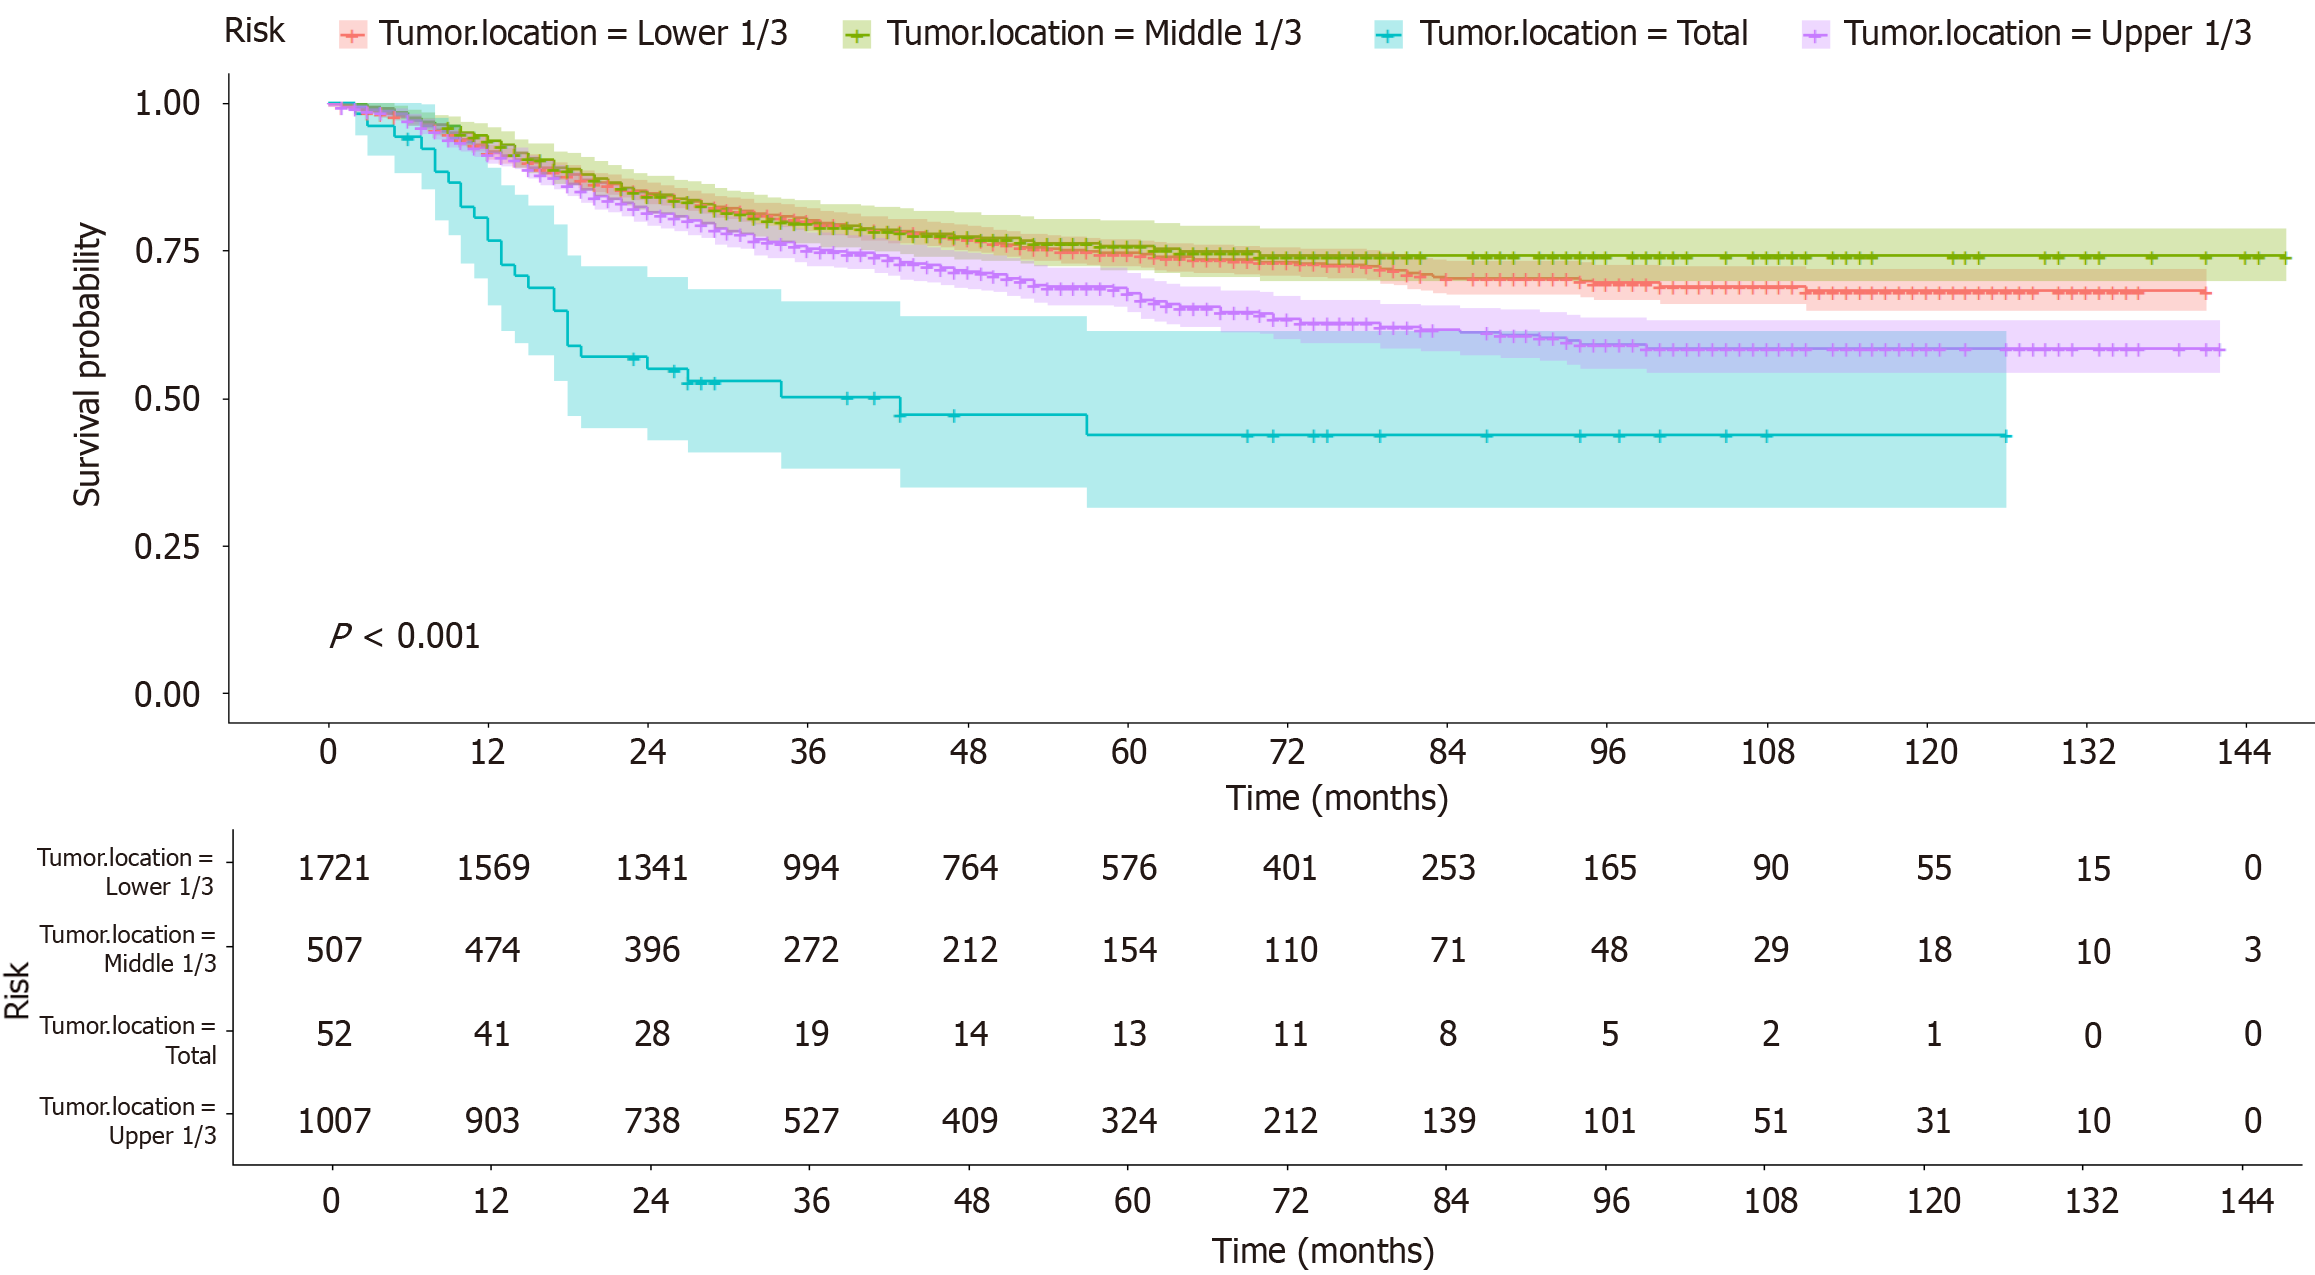
Figure 3 Kaplan-Meier survival curves for different locations of gastric cancer, where different colors represent different locations.
Red: Lower 1/3; green: Middle 1/3; blue: Total; purple: Upper 1/3). The solid line represents the Kaplan-Meier estimates for each group. The shaded area around the survival curve represents the 95% confidence interval, representing the range of fluctuations in the true survival estimate. A P value less than 0.05 was considered to indicate statistical significance.
- Citation: Huang YX, He HY, Chen K, Liu HD, Zu D, Liang C, Bao QM, Hu YC, Liu GX, Zhong YK, Zhang CK, Deng MC, He YH, Jing J, Shi Y, Xu SF, Teng YS, Ye Z, Cheng XD. Prognostic impact and reasons for variability by tumor location in gastric cancer. World J Gastroenterol 2024; 30(44): 4709-4724
- URL: https://www.wjgnet.com/1007-9327/full/v30/i44/4709.htm
- DOI: https://dx.doi.org/10.3748/wjg.v30.i44.4709


