Copyright
©The Author(s) 2024.
World J Gastroenterol. Nov 21, 2024; 30(43): 4620-4635
Published online Nov 21, 2024. doi: 10.3748/wjg.v30.i43.4620
Published online Nov 21, 2024. doi: 10.3748/wjg.v30.i43.4620
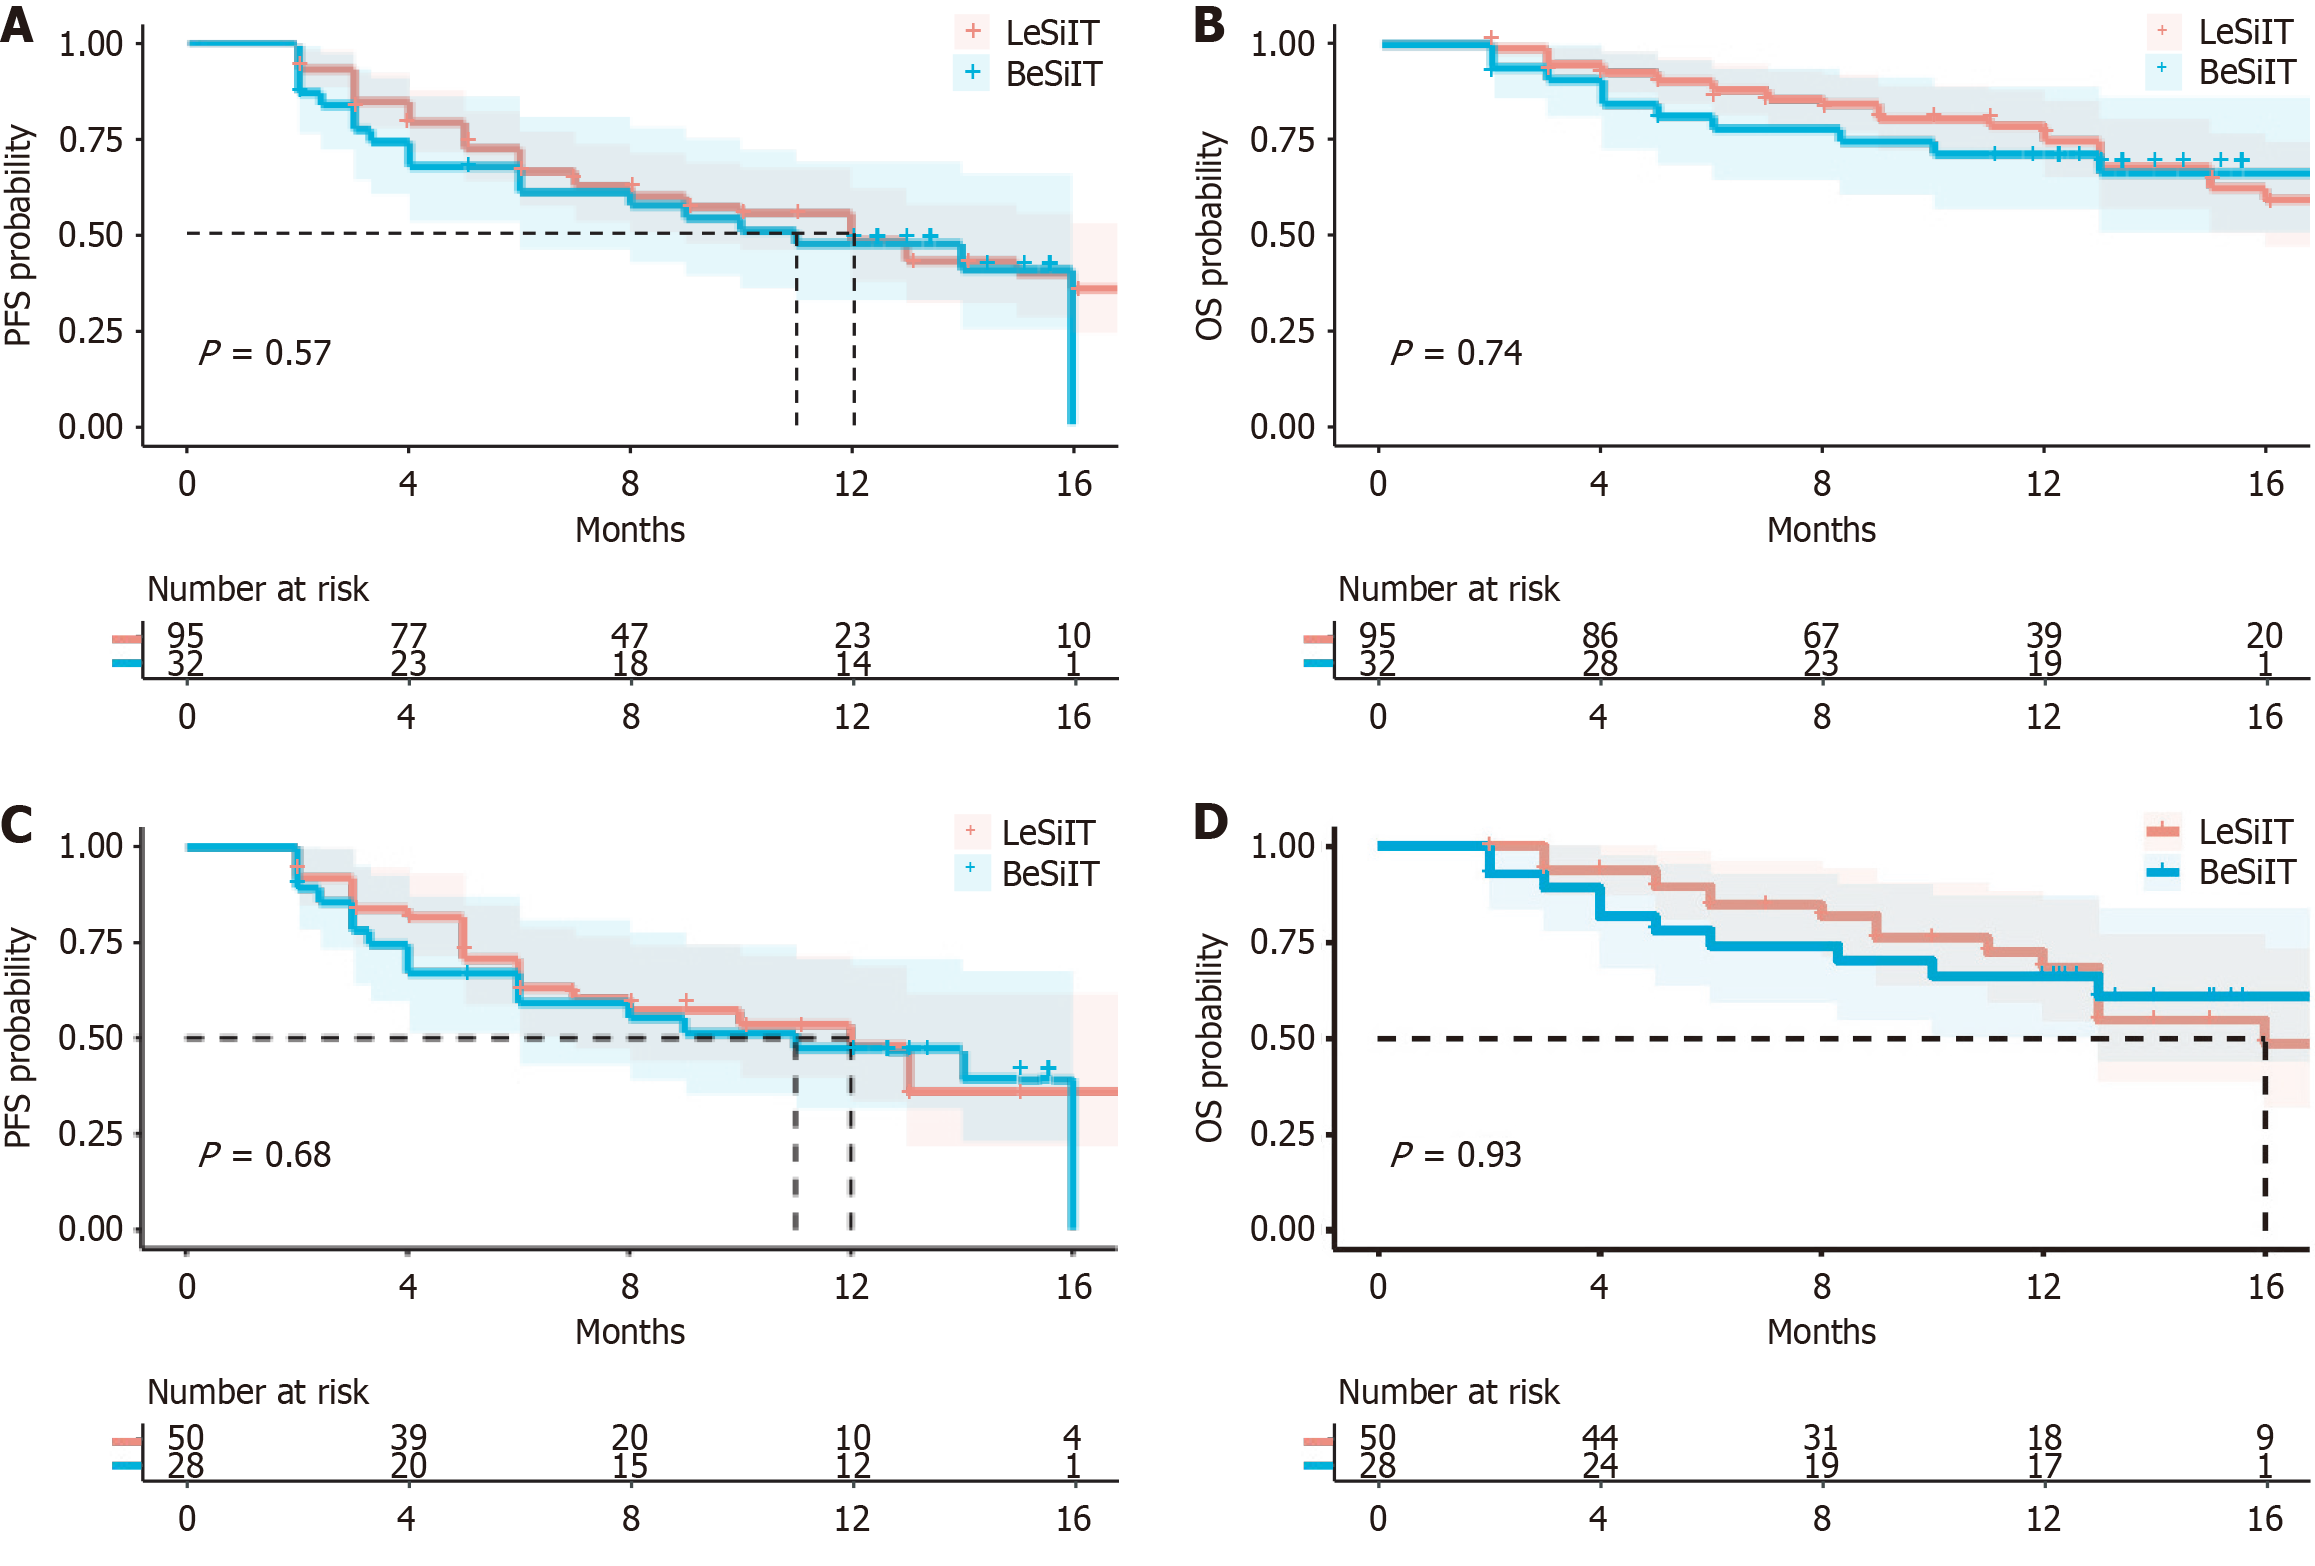
Figure 2 Kaplan-Meier curves between the lenvatinib plus sintilimab plus interventional treatment and bevacizumab plus sintilimab plus interventional treatment groups.
A: Kaplan-Meier curves based on propensity score matching (PFS) before propensity score matching (PSM); B: Kaplan-Meier curves based on overall survival (OS) before PSM; C: Kaplan-Meier curves based on PFS after PSM; D: Kaplan-Meier curves based on OS after PSM. PFS: Progression-free survival; OS: Overall survival; PSM: Propensity score matching; BeSiIT: Bevacizumab plus sintilimab plus interventional treatment; LeSiIT: Lenvatinib plus sintilimab plus interventional treatment.
- Citation: Han RY, Gan LJ, Lang MR, Ren SH, Liu DM, Li GT, Liu YY, Tian XD, Zhu KW, Sun LY, Chen L, Song TQ. Lenvatinib, sintilimab combined interventional treatment vs bevacizumab, sintilimab combined interventional treatment for intermediate-advanced unresectable hepatocellular carcinoma. World J Gastroenterol 2024; 30(43): 4620-4635
- URL: https://www.wjgnet.com/1007-9327/full/v30/i43/4620.htm
- DOI: https://dx.doi.org/10.3748/wjg.v30.i43.4620


