Copyright
©The Author(s) 2024.
World J Gastroenterol. Nov 21, 2024; 30(43): 4609-4619
Published online Nov 21, 2024. doi: 10.3748/wjg.v30.i43.4609
Published online Nov 21, 2024. doi: 10.3748/wjg.v30.i43.4609
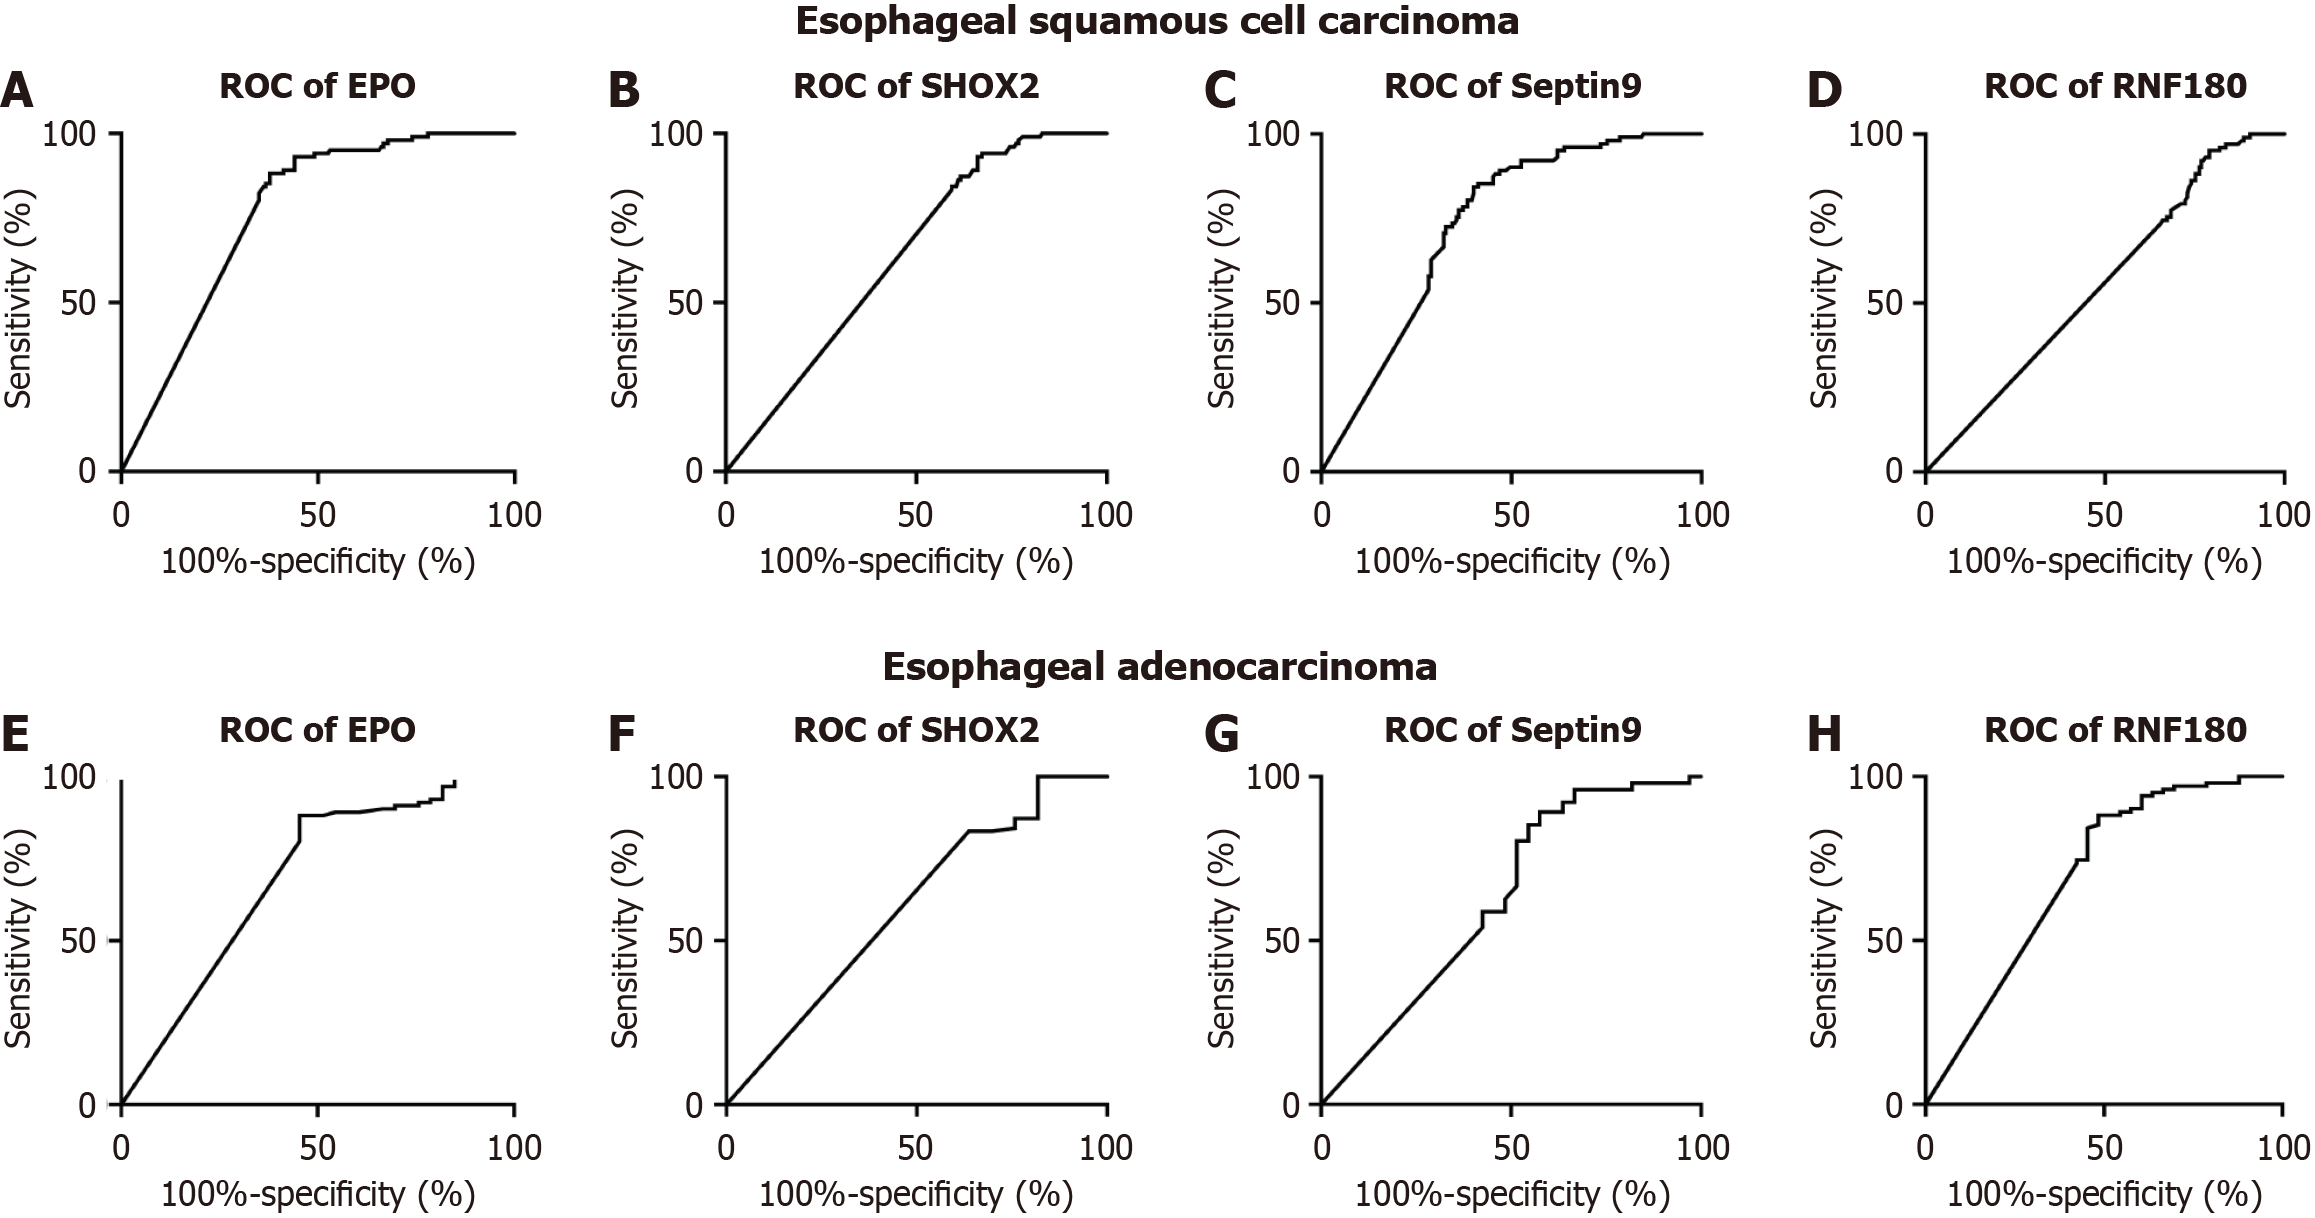
Figure 4 Receiver operating characteristic curve analysis of SHOX2, RNF180, SEPTIN9, and EPO methylation biomarkers.
A-D: Receiver operating characteristic (ROC) curves of methylation for squamous cell carcinoma. Area under the curve (AUC)-SHOX2 = 0.639 (95%CI: 0.575–0.703), AUC-SEPTIN9 = 0.731 (95%CI: 0.673–0.789), AUC-EPO = 0.765 (95%CI: 0.710–0.820), and AUC-RNF180 = 0.559 (95%CI: 0.491–0.626); E-H: ROC curve analysis of methylation for adenocarcinoma. AUC-SHOX2 = 0.601 (95%CI: 0.484–0.719), AUC-SEPTIN9 = 0.626 (95%CI: 0.504–0.749), AUC-EPO = 0.691 (95%CI: 0.577–0.805), and AUC-RNF180 = 0.697 (95%CI: 0.582–0.813). ROC: Receiver operating characteristic.
- Citation: Liu XJ, Pi GL, Wang S, Kai JD, Yu HF, Shi HW, Yu J, Zeng H. Plasma DNA methylation detection for early screening, diagnosis, and monitoring of esophageal adenocarcinoma and squamous cell carcinoma. World J Gastroenterol 2024; 30(43): 4609-4619
- URL: https://www.wjgnet.com/1007-9327/full/v30/i43/4609.htm
- DOI: https://dx.doi.org/10.3748/wjg.v30.i43.4609


