Copyright
©The Author(s) 2024.
World J Gastroenterol. Nov 7, 2024; 30(41): 4461-4480
Published online Nov 7, 2024. doi: 10.3748/wjg.v30.i41.4461
Published online Nov 7, 2024. doi: 10.3748/wjg.v30.i41.4461
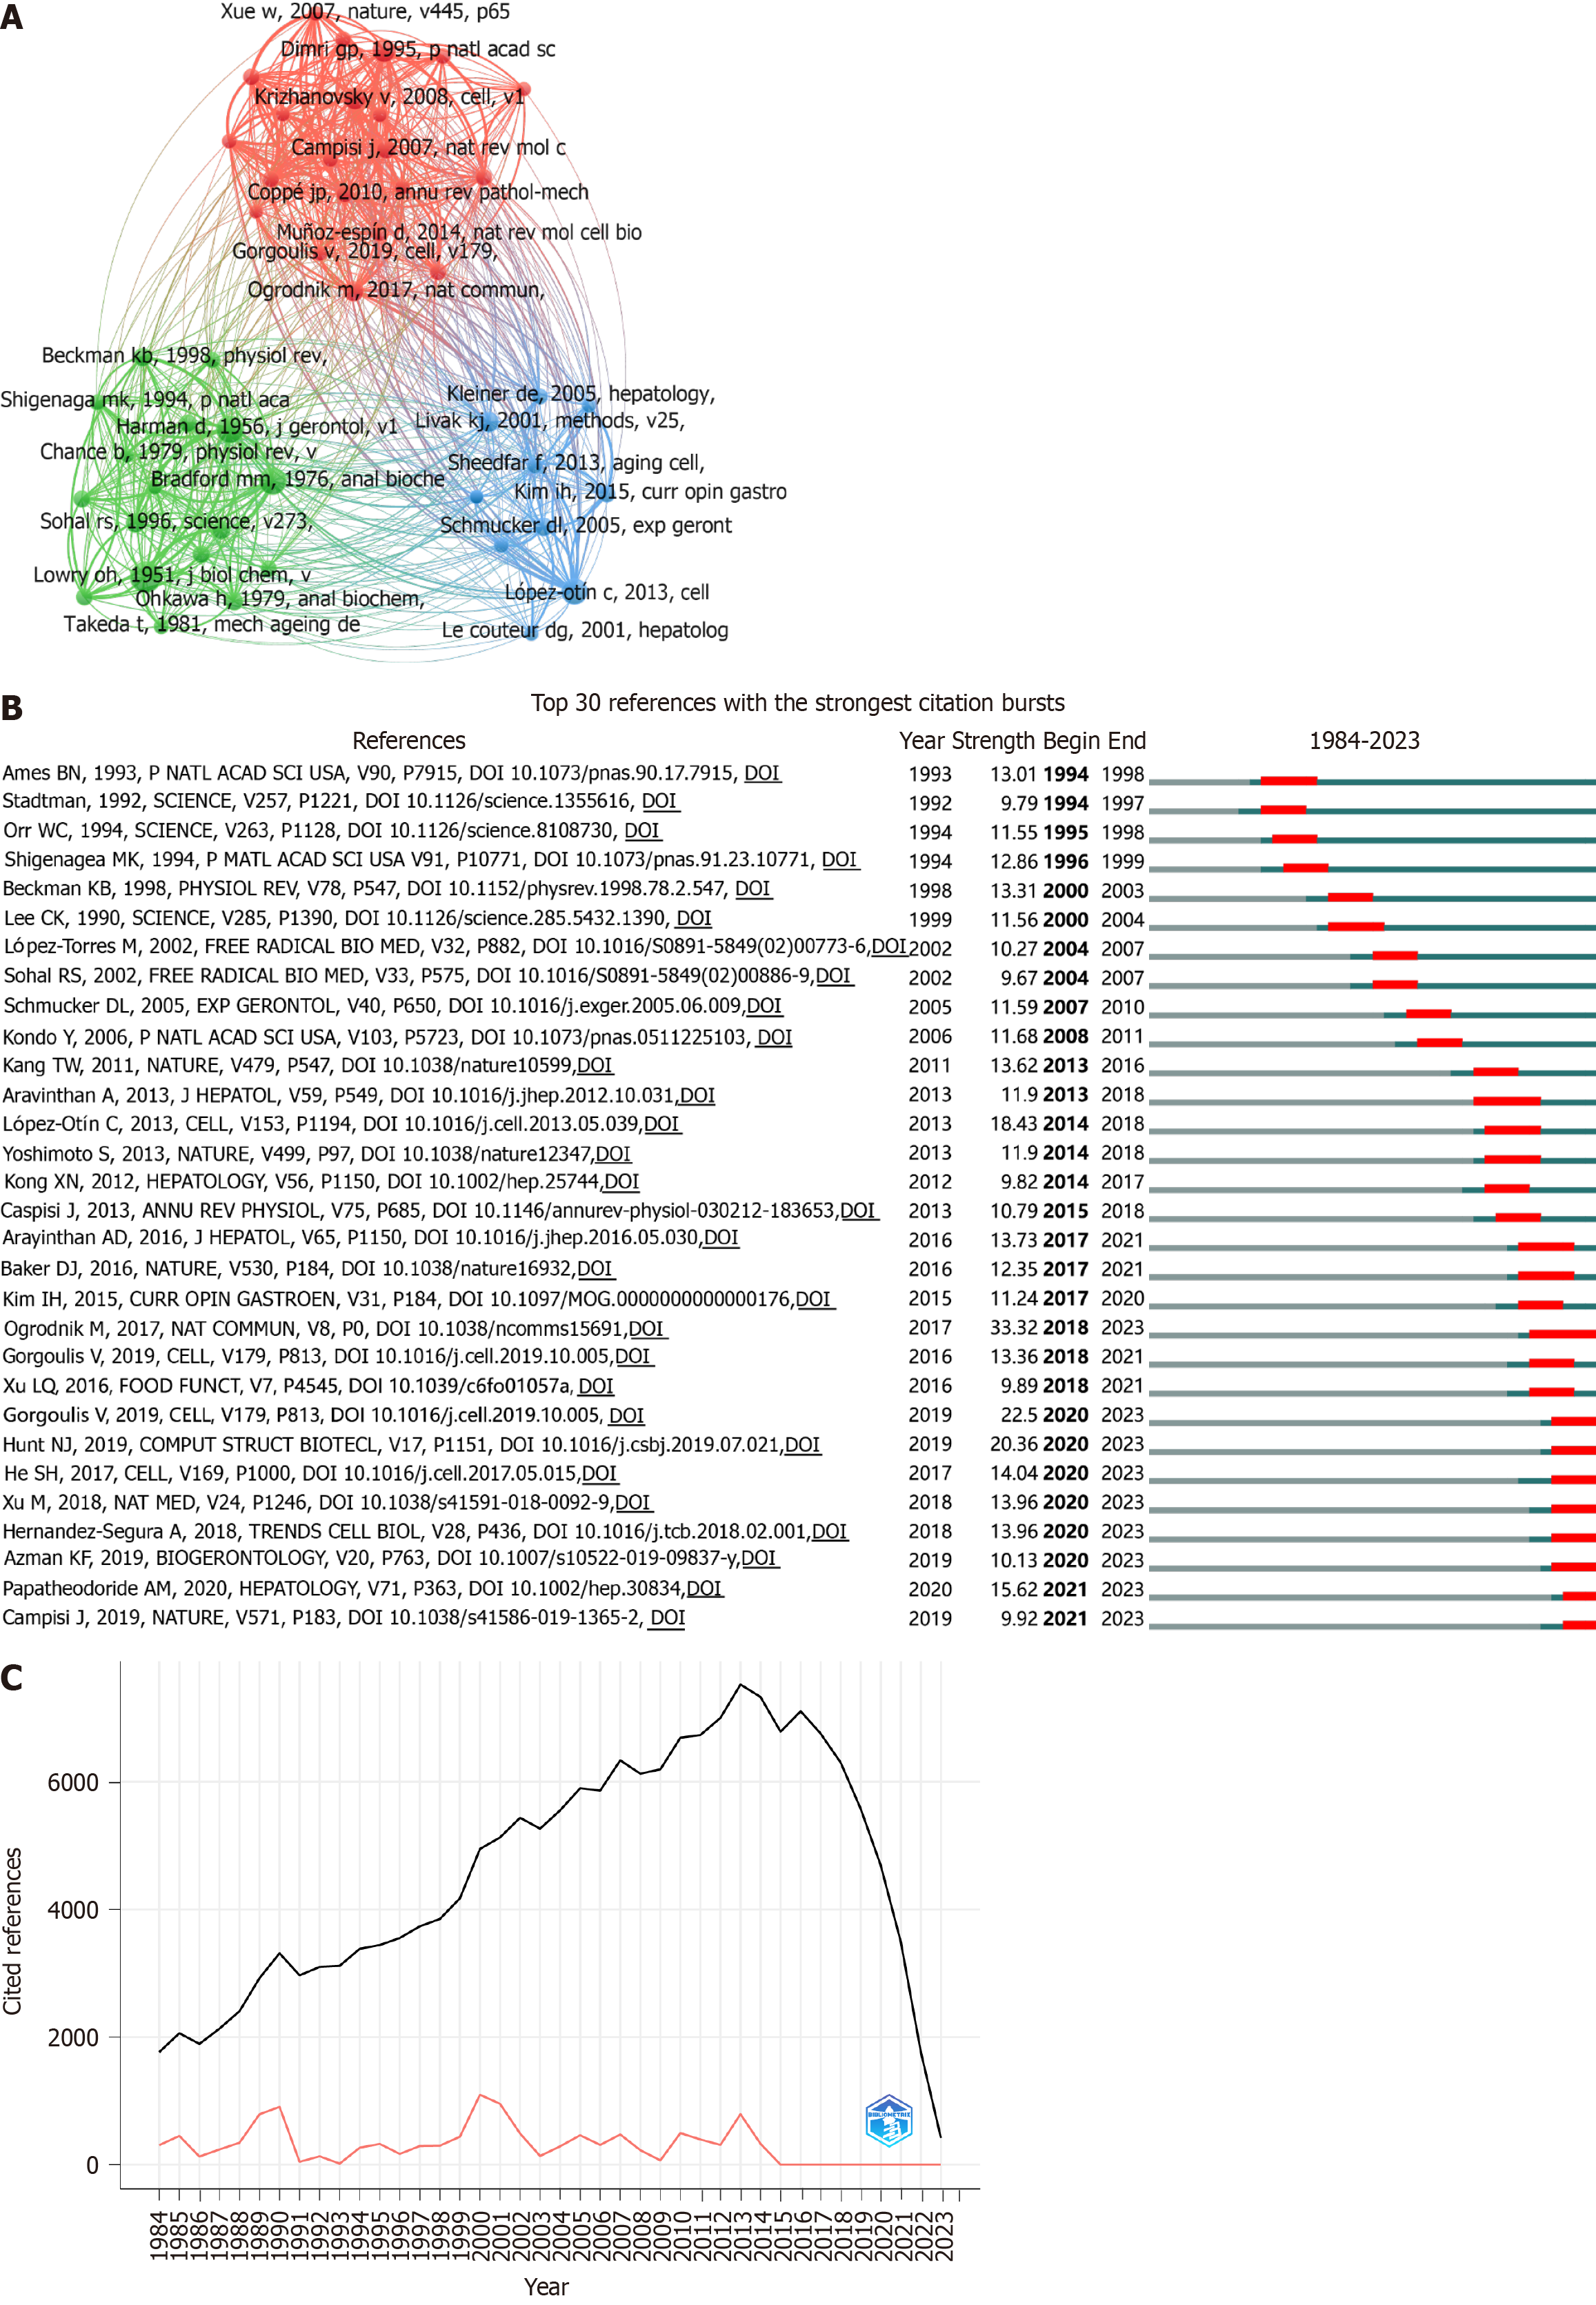
Figure 6 Citation analysis in liver aging research.
A: Network map of the top 48 co-cited references, each cited more than 45 times; B: Top 30 references with the strongest citation bursts, the red segment represents the period of emergence, with burst strength proportional of the segment length; C: Reference publication year spectroscopy (RPYS) revealing three citation peaks in 1990, 2000, and 2013.
- Citation: Han QH, Huang SM, Wu SS, Luo SS, Lou ZY, Li H, Yang YM, Zhang Q, Shao JM, Zhu LJ. Mapping the evolution of liver aging research: A bibliometric analysis. World J Gastroenterol 2024; 30(41): 4461-4480
- URL: https://www.wjgnet.com/1007-9327/full/v30/i41/4461.htm
- DOI: https://dx.doi.org/10.3748/wjg.v30.i41.4461


