Copyright
©The Author(s) 2024.
World J Gastroenterol. Nov 7, 2024; 30(41): 4461-4480
Published online Nov 7, 2024. doi: 10.3748/wjg.v30.i41.4461
Published online Nov 7, 2024. doi: 10.3748/wjg.v30.i41.4461
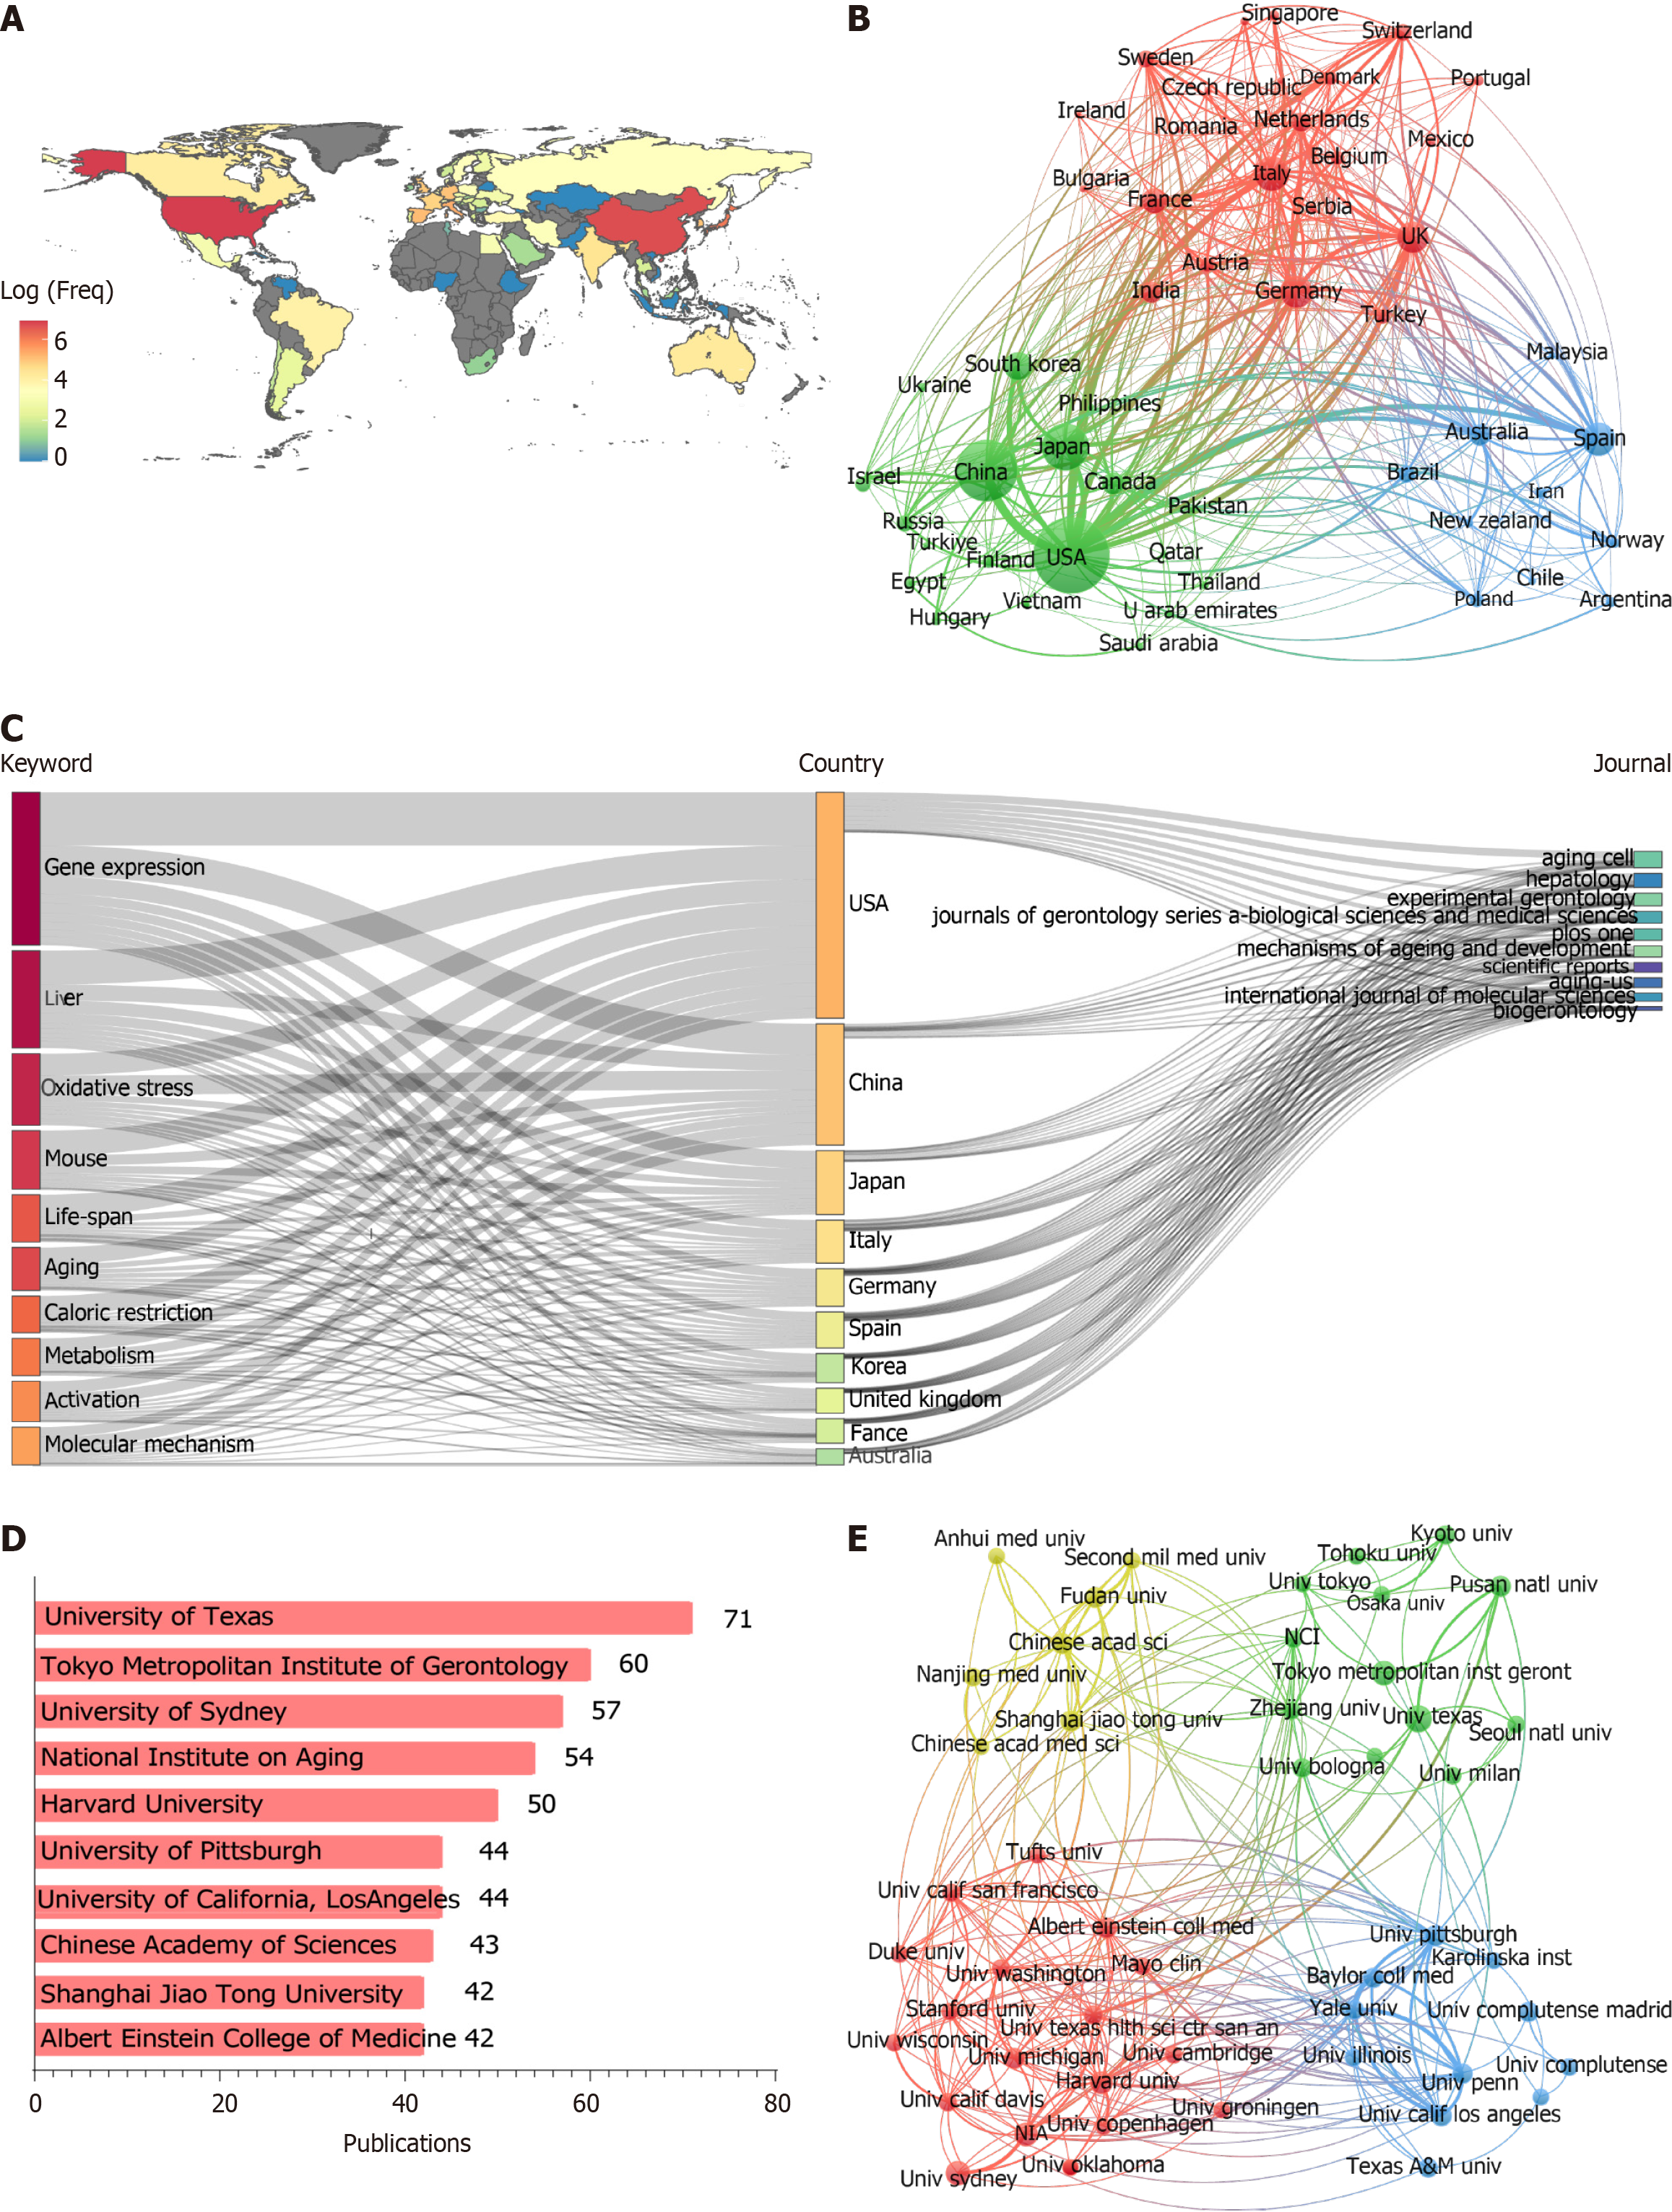
Figure 3 Analysis of publications by country and institution.
A: The distribution of countries (log-transformed scale of article count); B: Network maps showing countries involved in the research on liver aging, the size of the node indicates the number of papers; C: Three-field plot of keyword, countries and journals; D: The top 10 institutions ranked by publication count; E: Network maps of 49 institutions with at least 25 articles published in liver aging research. The node size represents the number of articles.
- Citation: Han QH, Huang SM, Wu SS, Luo SS, Lou ZY, Li H, Yang YM, Zhang Q, Shao JM, Zhu LJ. Mapping the evolution of liver aging research: A bibliometric analysis. World J Gastroenterol 2024; 30(41): 4461-4480
- URL: https://www.wjgnet.com/1007-9327/full/v30/i41/4461.htm
- DOI: https://dx.doi.org/10.3748/wjg.v30.i41.4461


