Copyright
©The Author(s) 2024.
World J Gastroenterol. Nov 7, 2024; 30(41): 4449-4460
Published online Nov 7, 2024. doi: 10.3748/wjg.v30.i41.4449
Published online Nov 7, 2024. doi: 10.3748/wjg.v30.i41.4449
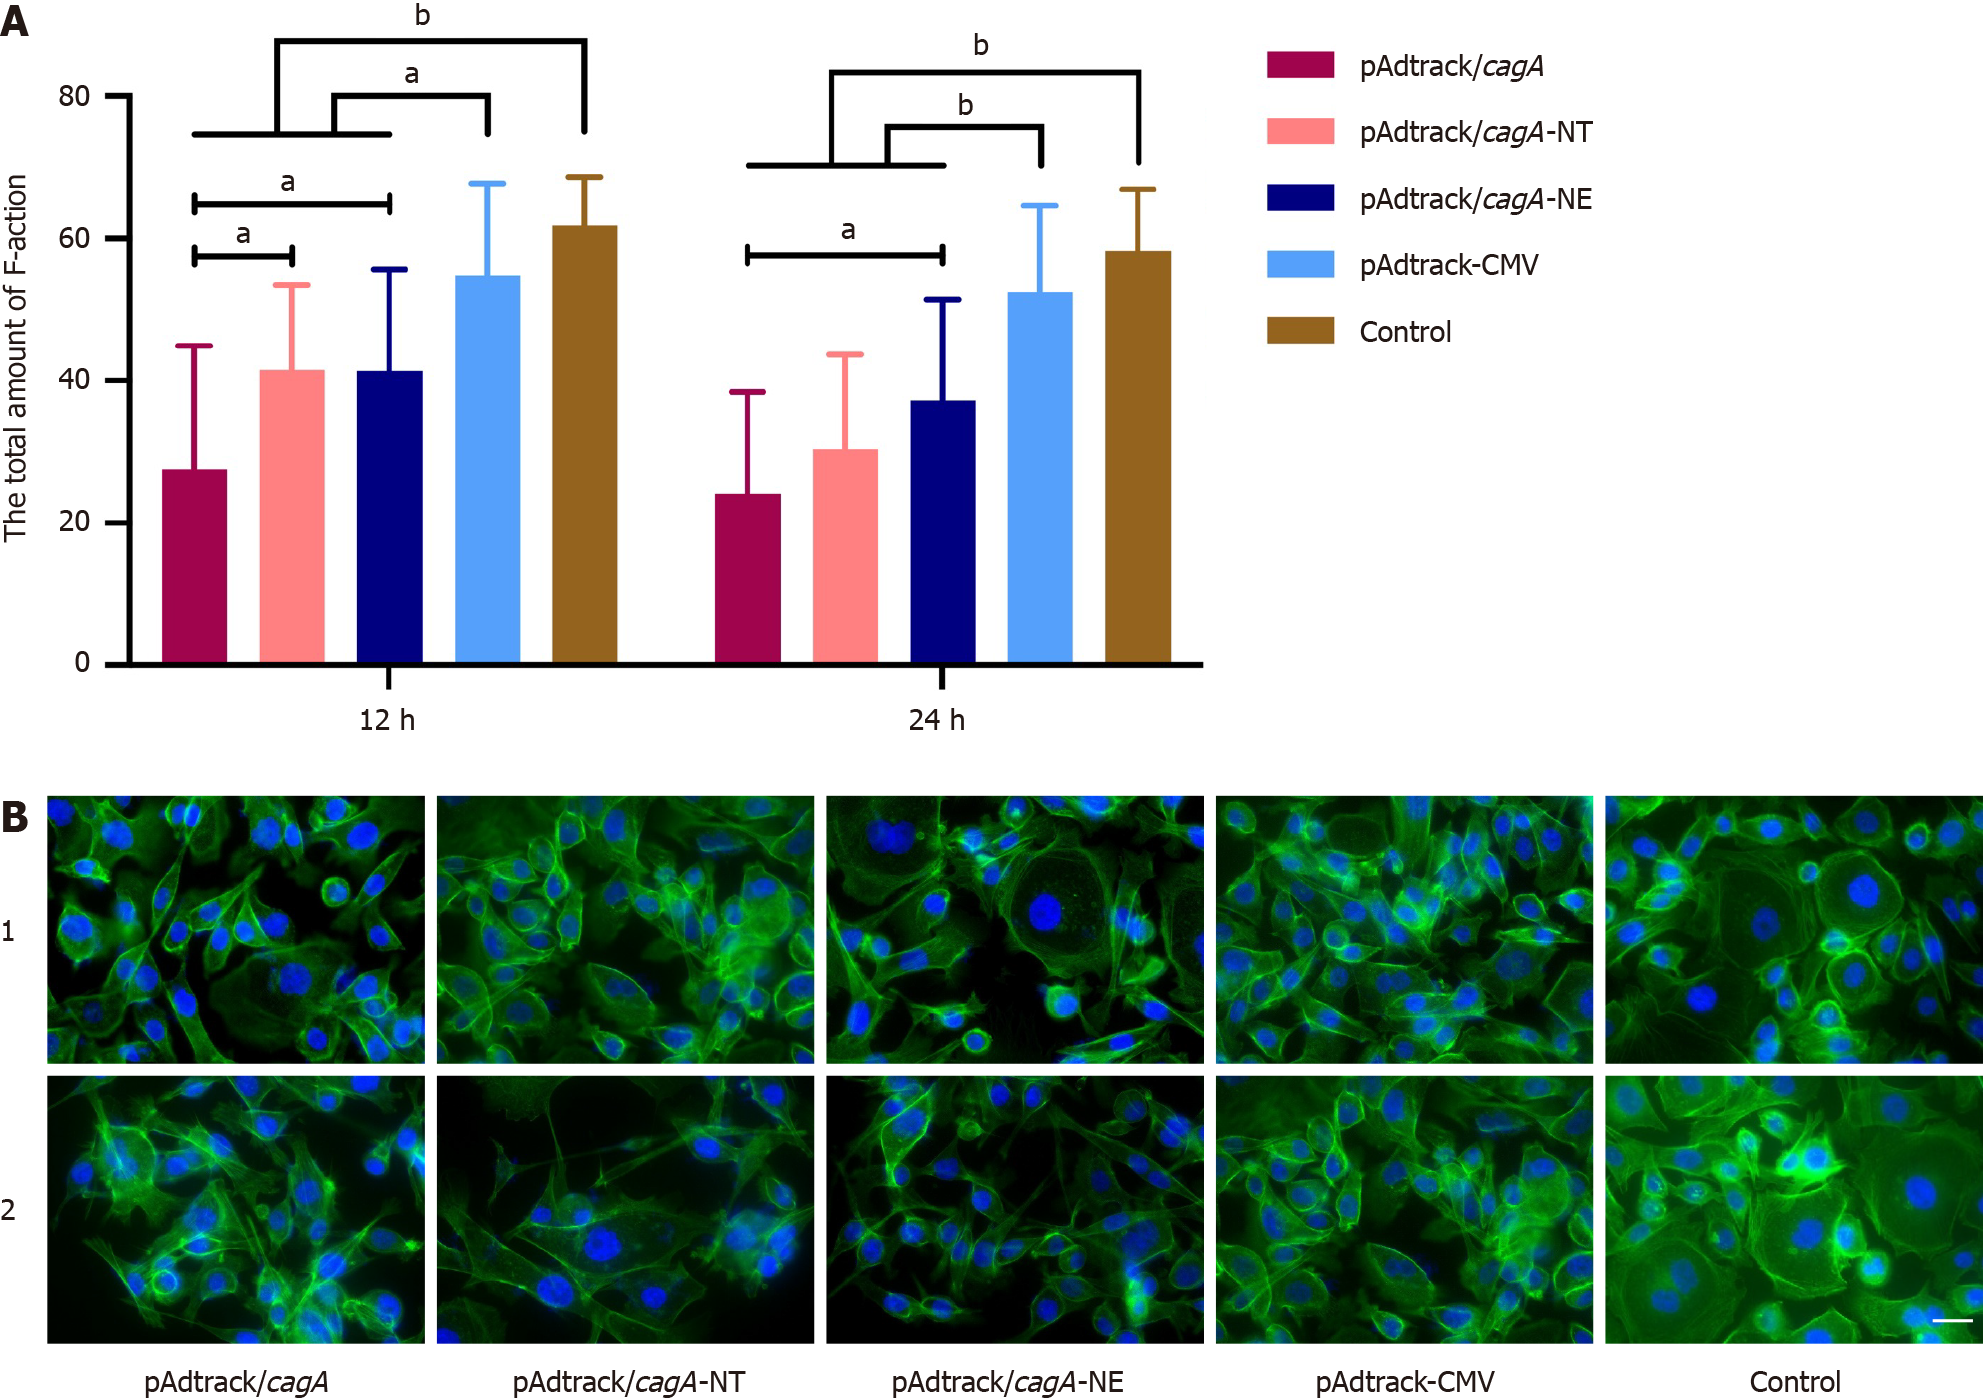
Figure 5 Quantification of the F-actin cytoskeleton with FITC phalloidin stain.
A: The average fluorescence intensity of F-actin at 12 hours and 24 hours after transfection. The data were mean ± SD of three independent experiments. Errors bars represented standard errors of the means. aP < 0.05, bP < 0.01; B: Representative micrographs of F-actin cytoskeleton as indicated (400 ×). AGS cells were labeled for F-actin using FITC phalloidin and the nucleus was stained with DAPI. F-actin was shown in green, and the nucleus was labeled with blue. 1 and 2 represented the F-actin cytoskeleton at 12 hours and 24 hours after transfection, respectively. Scale bar = 25 μm.
- Citation: Xue ZJ, Gong YN, He LH, Sun L, You YH, Fan DJ, Zhang MJ, Yan XM, Zhang JZ. Amino acid deletions at positions 893 and 894 of cytotoxin-associated gene A protein affect Helicobacter pylori gastric epithelial cell interactions. World J Gastroenterol 2024; 30(41): 4449-4460
- URL: https://www.wjgnet.com/1007-9327/full/v30/i41/4449.htm
- DOI: https://dx.doi.org/10.3748/wjg.v30.i41.4449


