Copyright
©The Author(s) 2024.
World J Gastroenterol. Nov 7, 2024; 30(41): 4449-4460
Published online Nov 7, 2024. doi: 10.3748/wjg.v30.i41.4449
Published online Nov 7, 2024. doi: 10.3748/wjg.v30.i41.4449
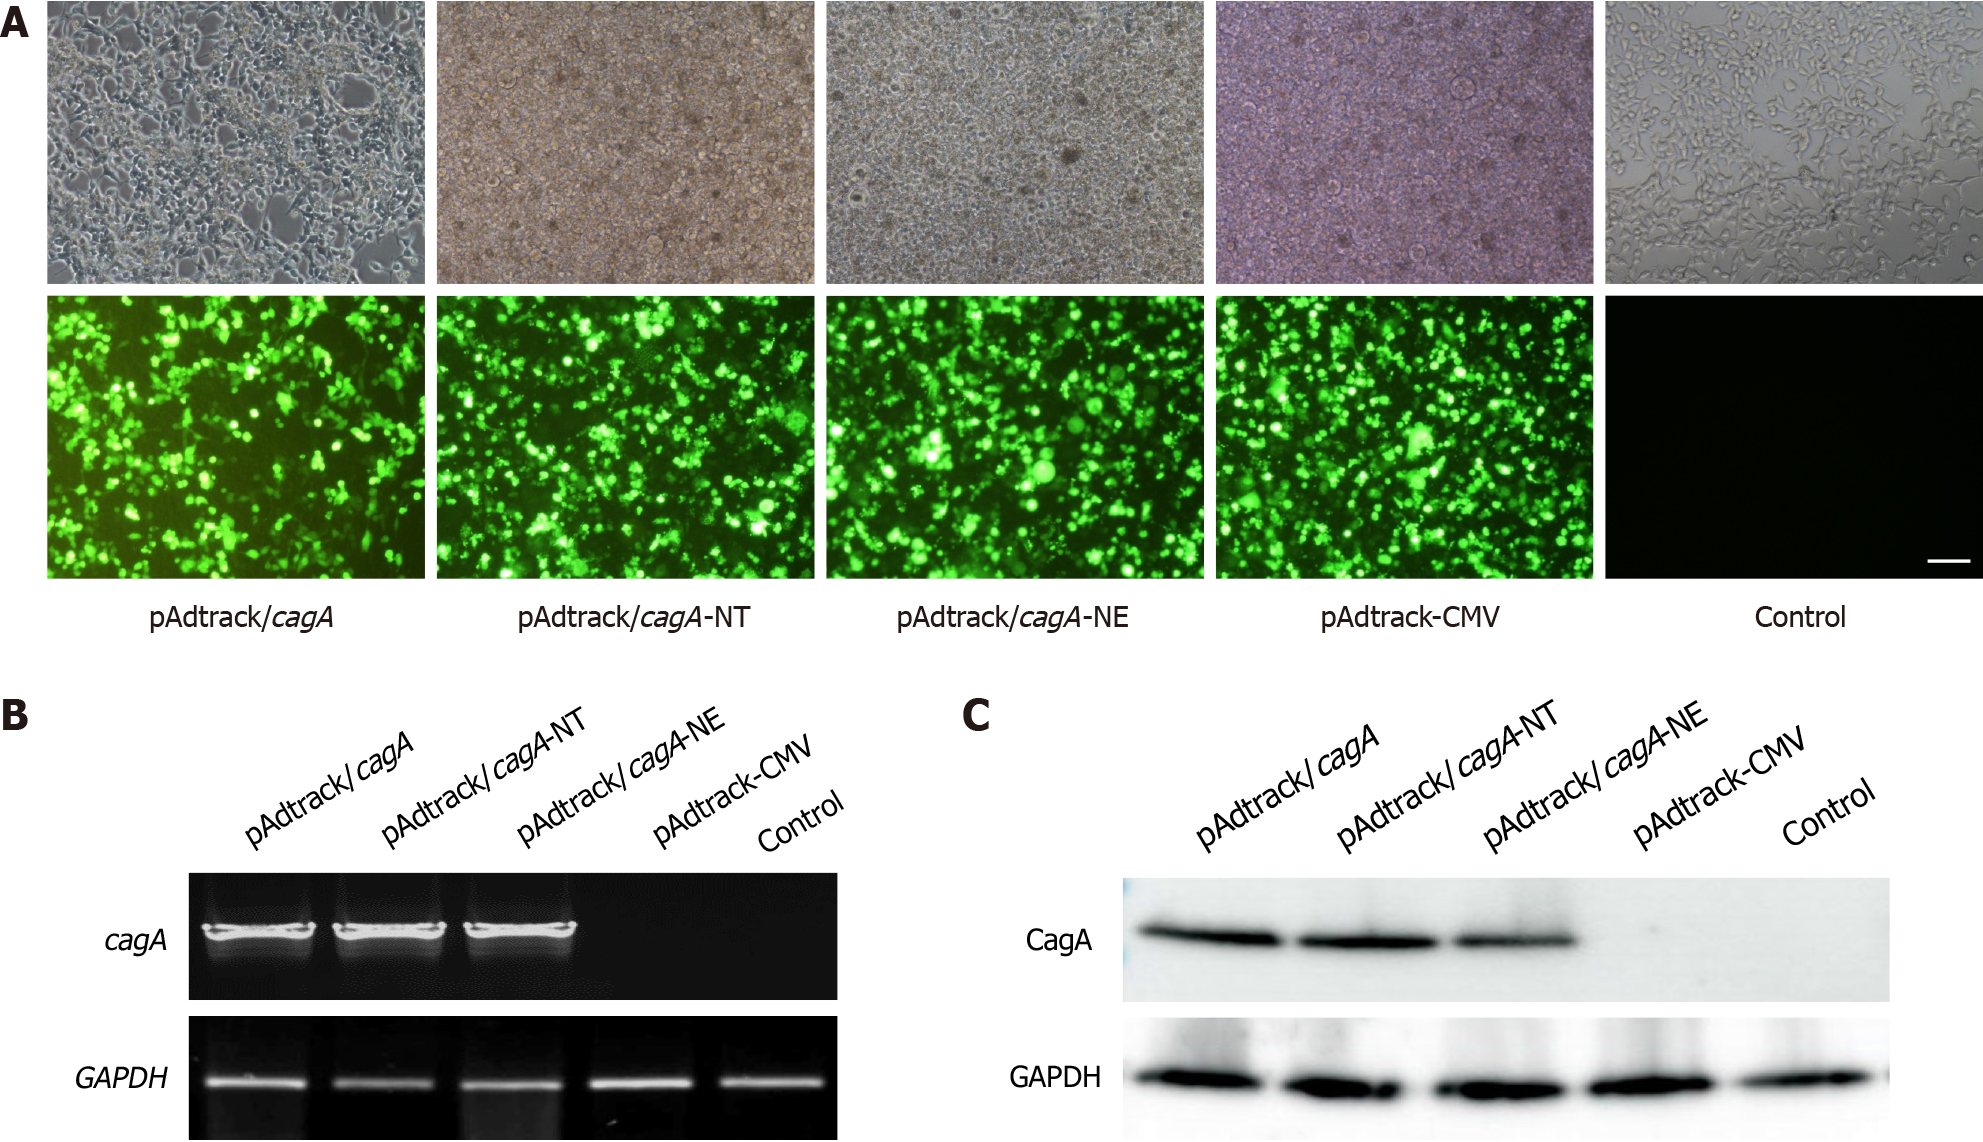
Figure 2 Detection of each plasmid transfection efficiency and expression of each cytotoxin-associated gene A in AGS cells.
A: Images under an ordinary light microscope and fluorescence photos after each cytotoxin-associated gene A (cagA) transfection into AGS (100 ×). Scale bar = 100 μm; B: The mRNA expression levels in AGS cells; C: The protein levels in AGS cells. CagA proteins were quantified using by Western blot analysis.
- Citation: Xue ZJ, Gong YN, He LH, Sun L, You YH, Fan DJ, Zhang MJ, Yan XM, Zhang JZ. Amino acid deletions at positions 893 and 894 of cytotoxin-associated gene A protein affect Helicobacter pylori gastric epithelial cell interactions. World J Gastroenterol 2024; 30(41): 4449-4460
- URL: https://www.wjgnet.com/1007-9327/full/v30/i41/4449.htm
- DOI: https://dx.doi.org/10.3748/wjg.v30.i41.4449


