Copyright
©The Author(s) 2024.
World J Gastroenterol. Oct 14, 2024; 30(38): 4211-4220
Published online Oct 14, 2024. doi: 10.3748/wjg.v30.i38.4211
Published online Oct 14, 2024. doi: 10.3748/wjg.v30.i38.4211
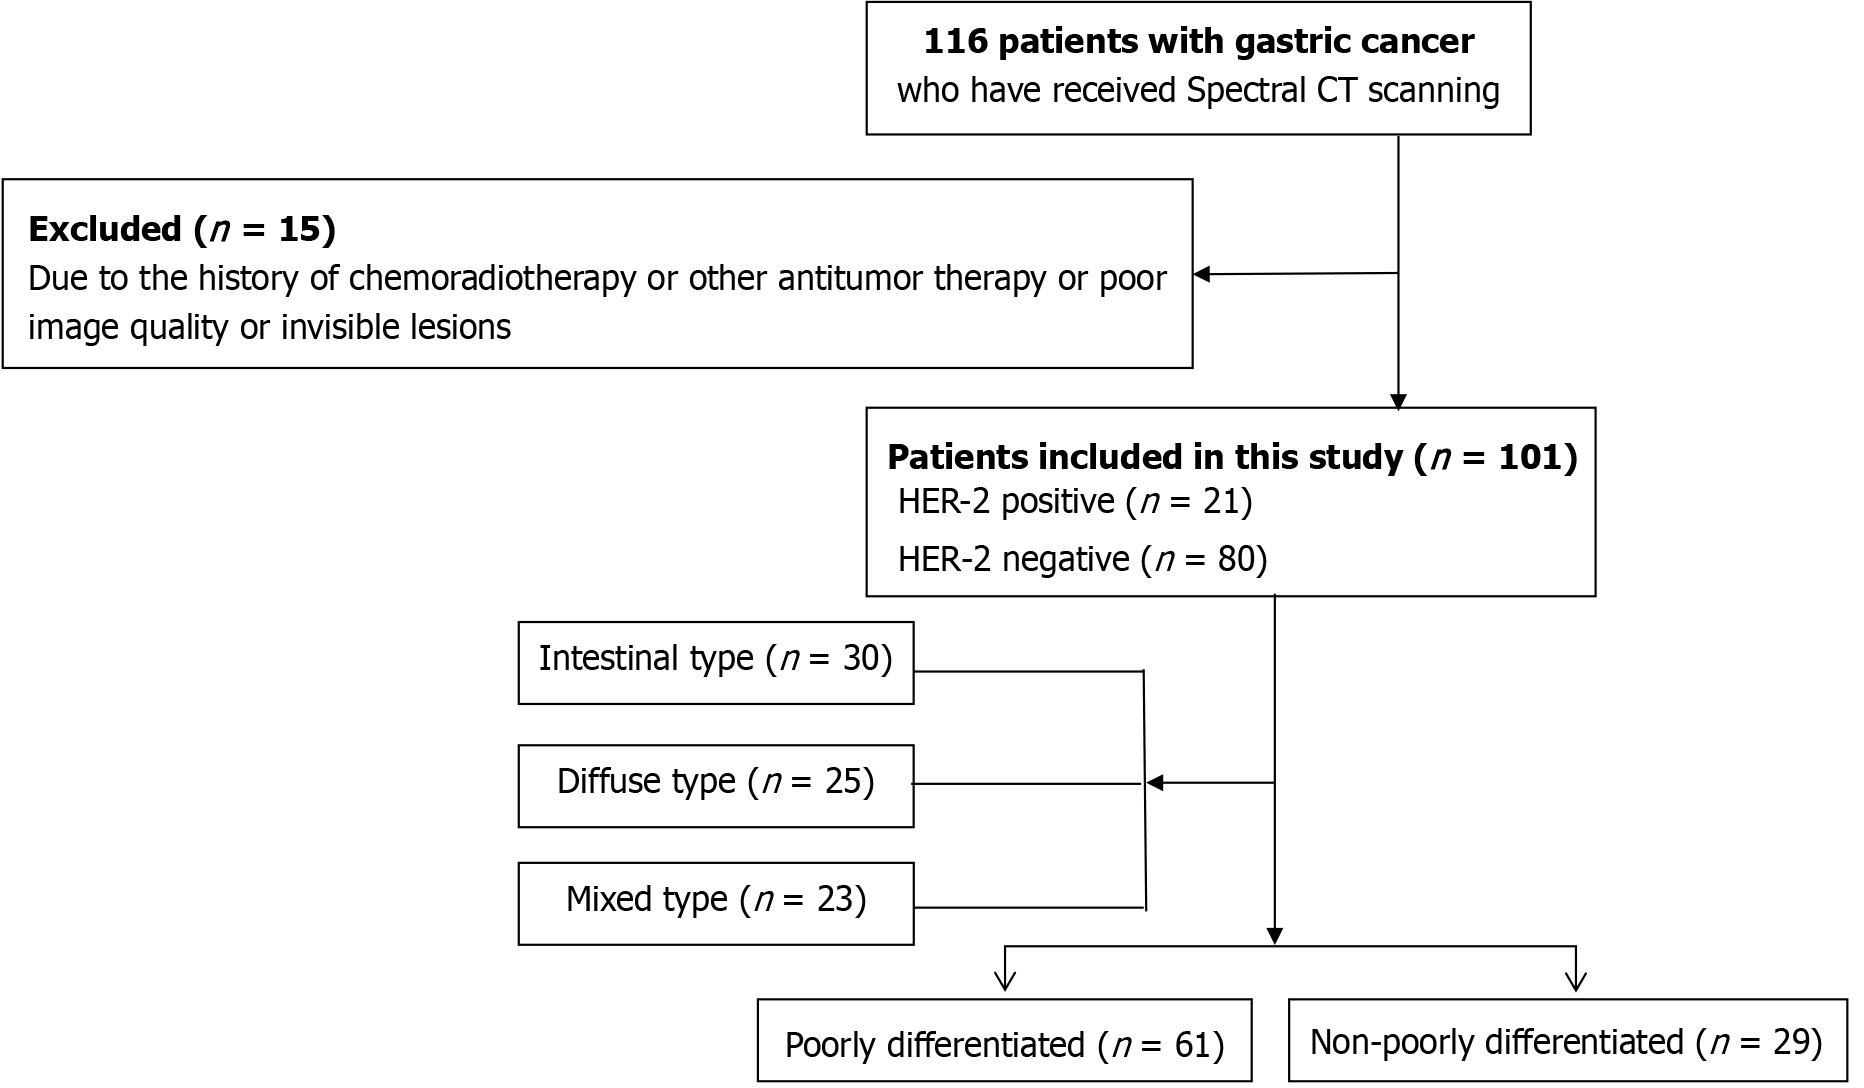
Figure 1 Diagram of study flow.
CT: Computed tomography.
- Citation: Zhang WL, Sun J, Huang RF, Zeng Y, Chen S, Wang XP, Chen JH, Chen YB, Zhu CS, Ye ZS, Xiao YP. Whole-volume histogram analysis of spectral-computed tomography iodine maps characterizes HER2 expression in gastric cancer. World J Gastroenterol 2024; 30(38): 4211-4220
- URL: https://www.wjgnet.com/1007-9327/full/v30/i38/4211.htm
- DOI: https://dx.doi.org/10.3748/wjg.v30.i38.4211


