Copyright
©The Author(s) 2024.
World J Gastroenterol. Oct 7, 2024; 30(37): 4132-4148
Published online Oct 7, 2024. doi: 10.3748/wjg.v30.i37.4132
Published online Oct 7, 2024. doi: 10.3748/wjg.v30.i37.4132
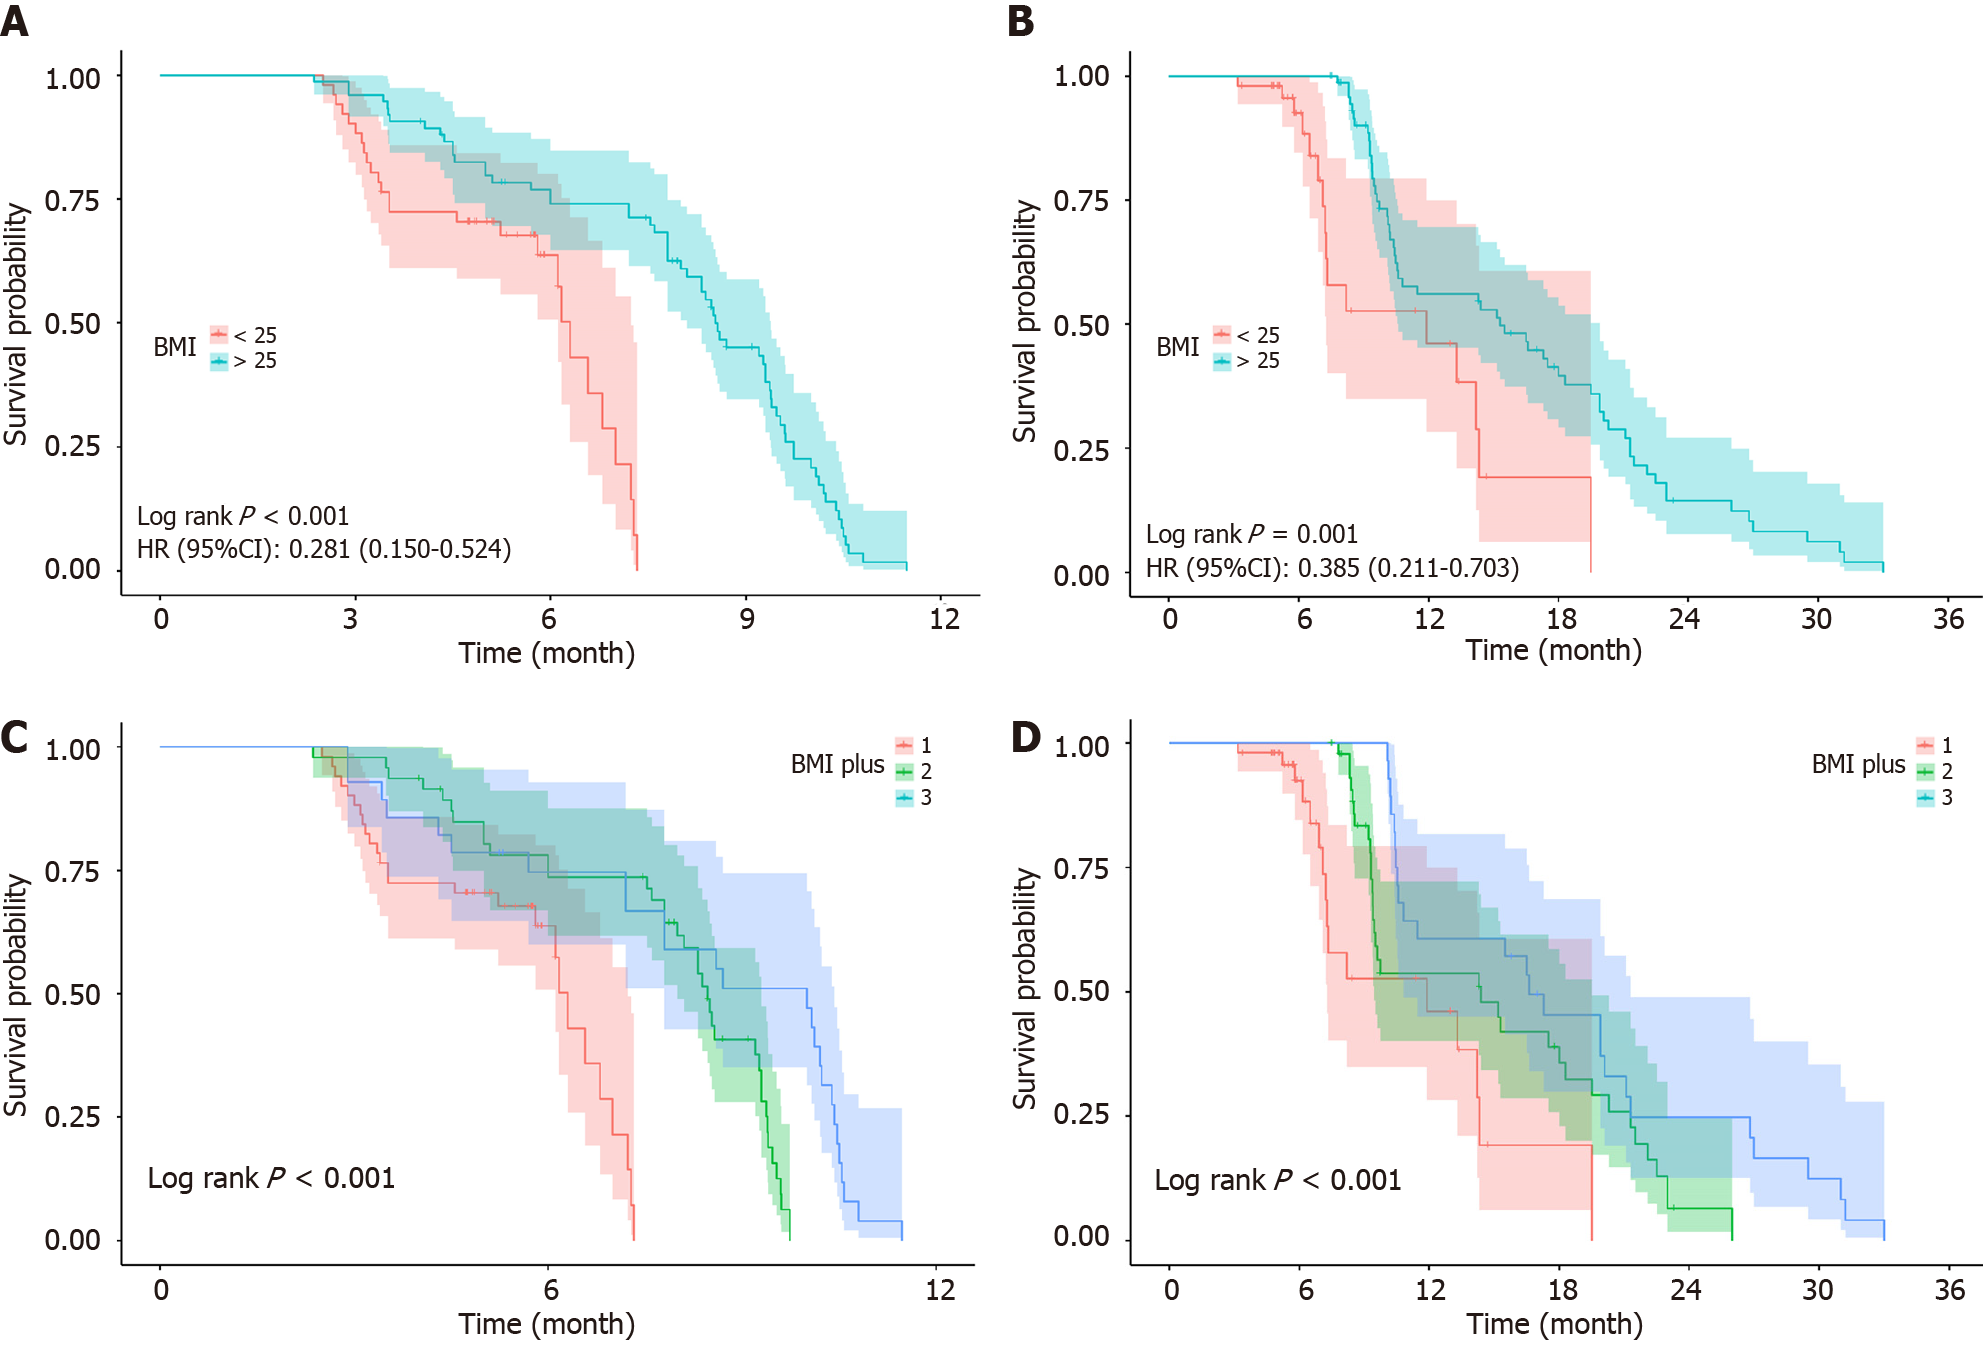
Figure 2 Graph depicting the effect of different body mass index values on long-term survival of patients and further subgroup analysis.
A: Kaplan-Meier plot of in the body mass index (BMI) ≤ 25 kg/m2 and BMI > 25 kg/m2 groups; B: Kaplan-Meier plot of overall survival in the BMI ≤ 25 kg/m2 and BMI > 25 kg/m2 groups; C: Kaplan-Meier plot of analysis of progression-free survival subgroup by BMI; D: Kaplan-Meier plot of analysis of the overall survival subgroup by BMI. BMI: Body mass index; HR: Hazard ratio; CI: Confidence interval.
- Citation: Wang YQ, Pan D, Yao ZY, Li YQ, Qu PF, Wang RB, Gu QH, Jiang J, Han ZX, Liu HN. Impact of baseline body mass index on the long-term prognosis of advanced hepatocellular carcinoma treated with immunotherapy. World J Gastroenterol 2024; 30(37): 4132-4148
- URL: https://www.wjgnet.com/1007-9327/full/v30/i37/4132.htm
- DOI: https://dx.doi.org/10.3748/wjg.v30.i37.4132


