Copyright
©The Author(s) 2024.
World J Gastroenterol. Sep 28, 2024; 30(36): 4057-4070
Published online Sep 28, 2024. doi: 10.3748/wjg.v30.i36.4057
Published online Sep 28, 2024. doi: 10.3748/wjg.v30.i36.4057
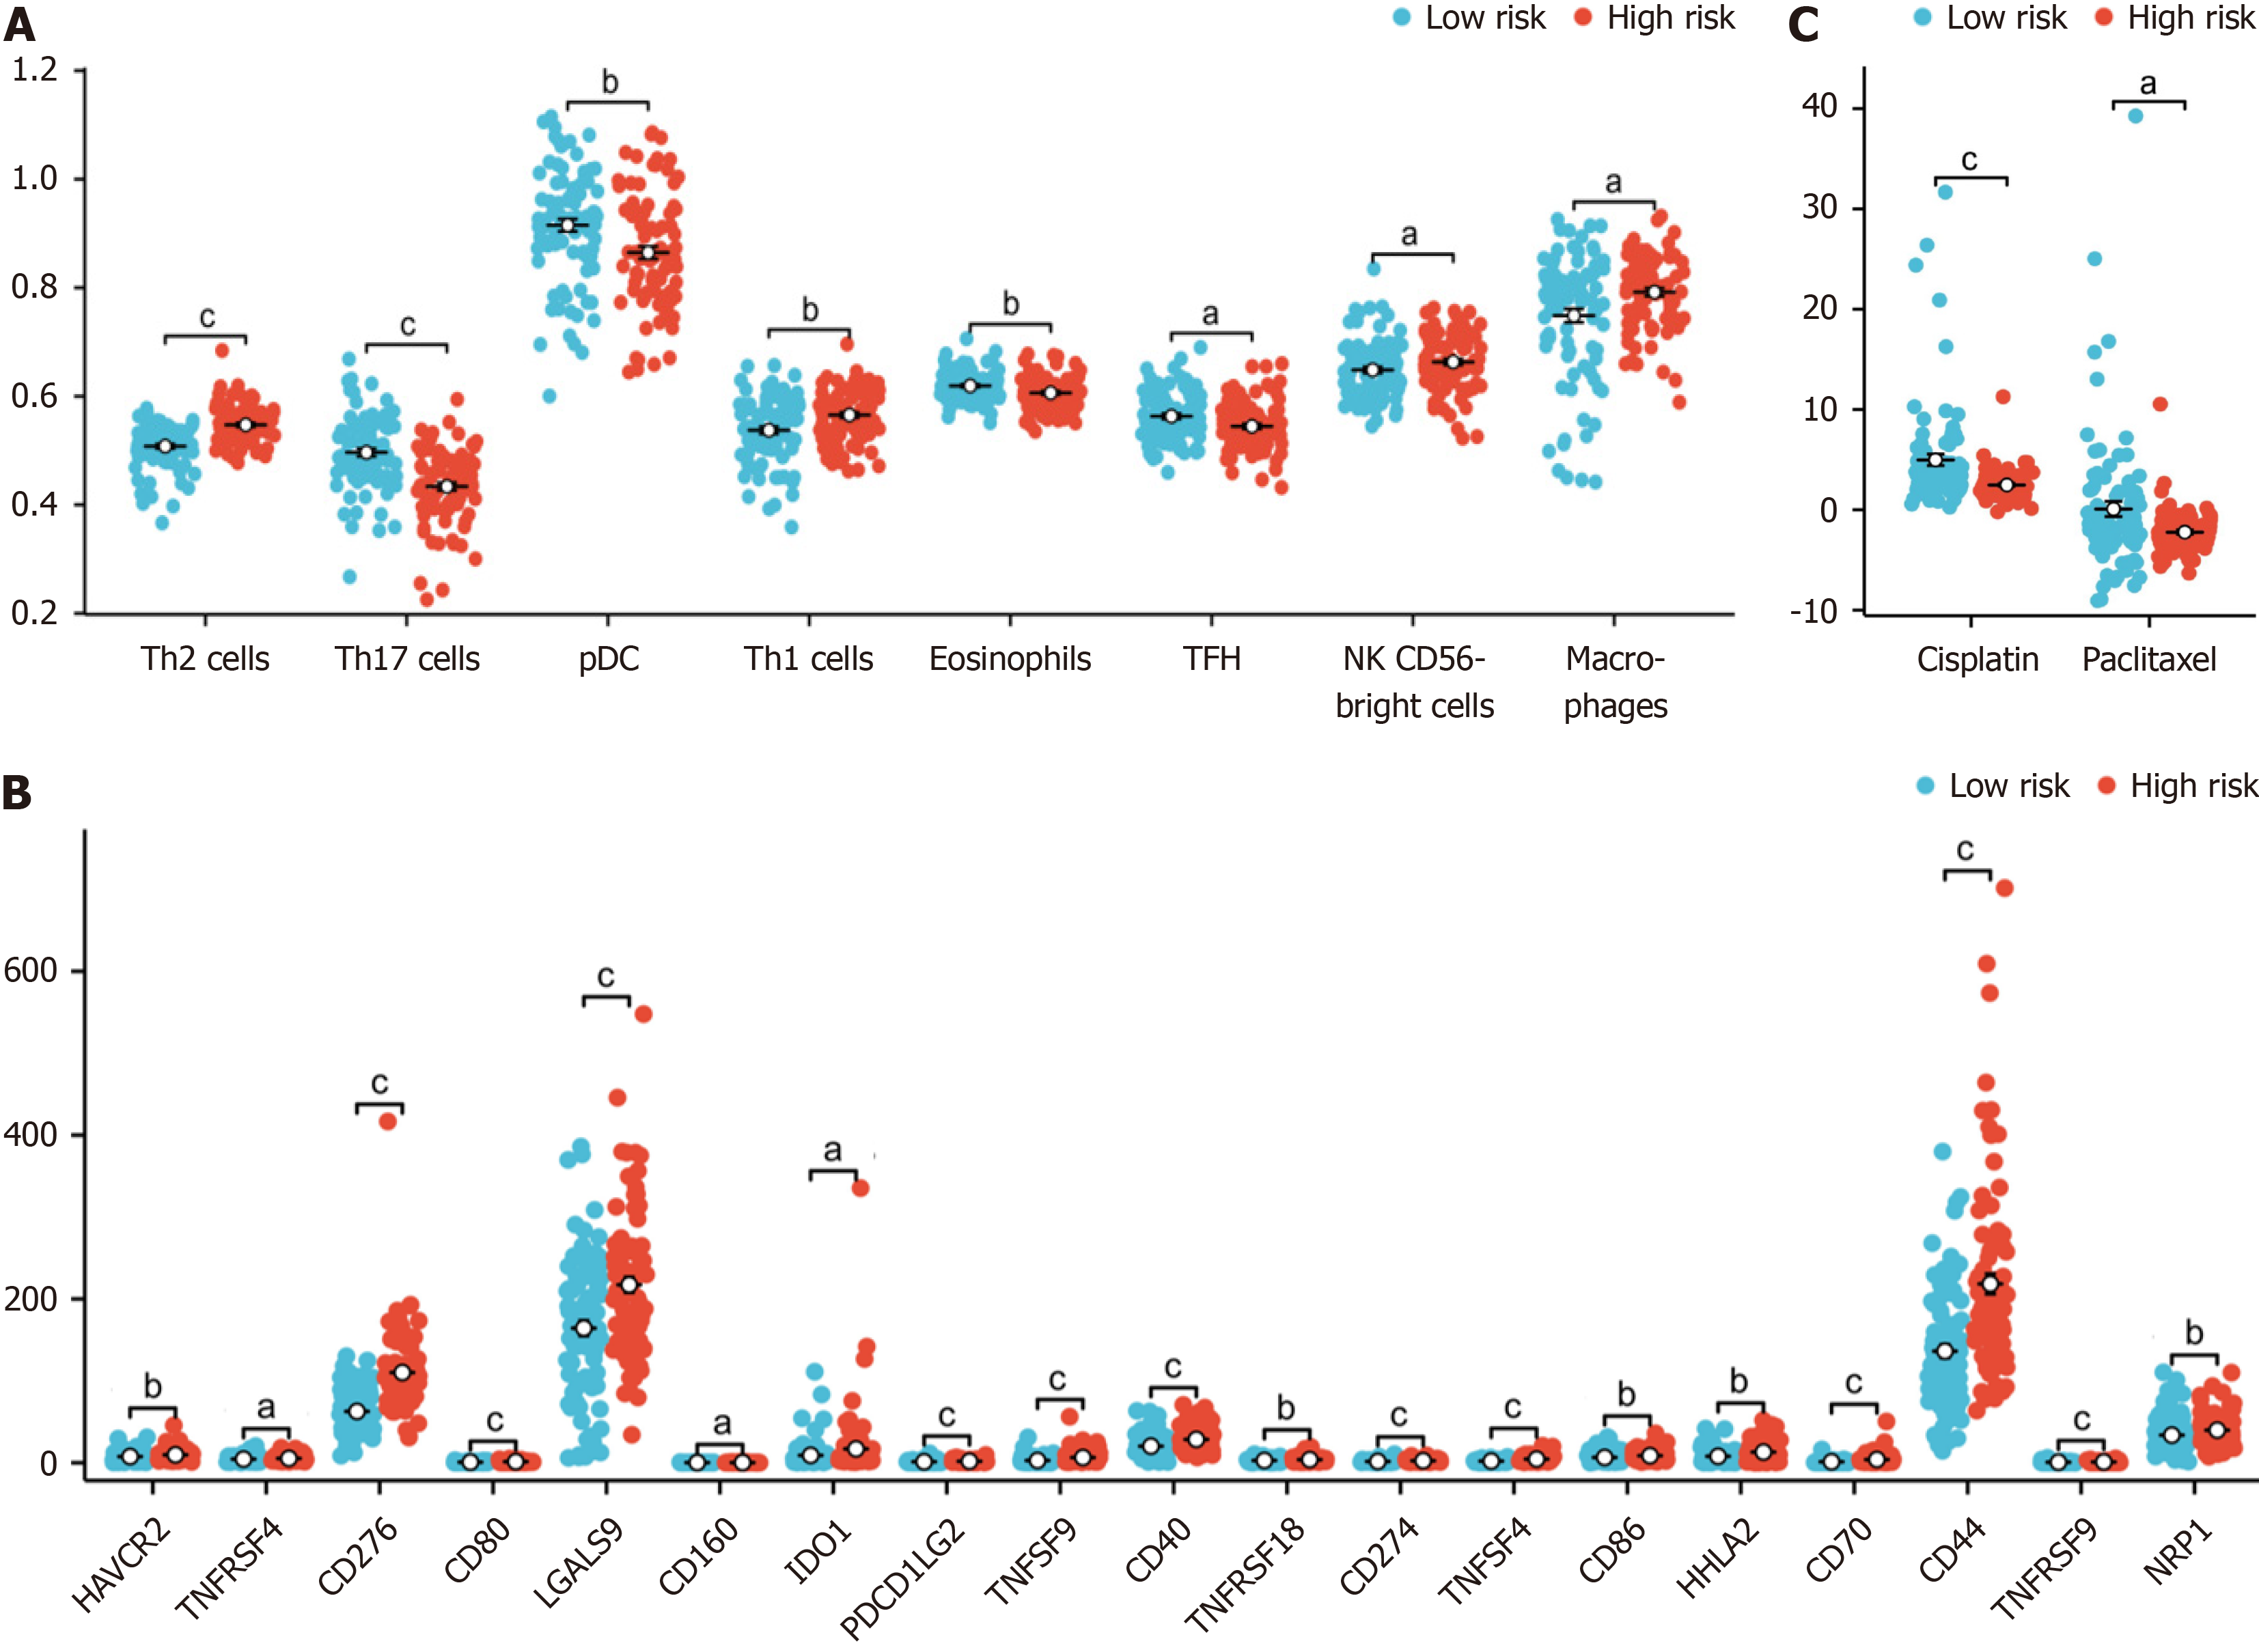
Figure 6 Association of immune infiltration with the risk score in the cancer genome atlas-pancreatic adenocarcinoma dataset.
A: Box plot showing the difference in the level of immune cell infiltration between the high-risk and low-risk groups; B: The box plot shows the difference in immune checkpoint expression between the high-risk and low-risk groups; C: The estimated half-maximal inhibitory concentration of different hypoxia-related risk groups. aP < 0.05, bP < 0.01, cP < 0.001.
- Citation: Yang F, Jiang N, Li XY, Qi XS, Tian ZB, Guo YJ. Construction and validation of a pancreatic cancer prognostic model based on genes related to the hypoxic tumor microenvironment. World J Gastroenterol 2024; 30(36): 4057-4070
- URL: https://www.wjgnet.com/1007-9327/full/v30/i36/4057.htm
- DOI: https://dx.doi.org/10.3748/wjg.v30.i36.4057


