Copyright
©The Author(s) 2024.
World J Gastroenterol. Sep 14, 2024; 30(34): 3894-3925
Published online Sep 14, 2024. doi: 10.3748/wjg.v30.i34.3894
Published online Sep 14, 2024. doi: 10.3748/wjg.v30.i34.3894
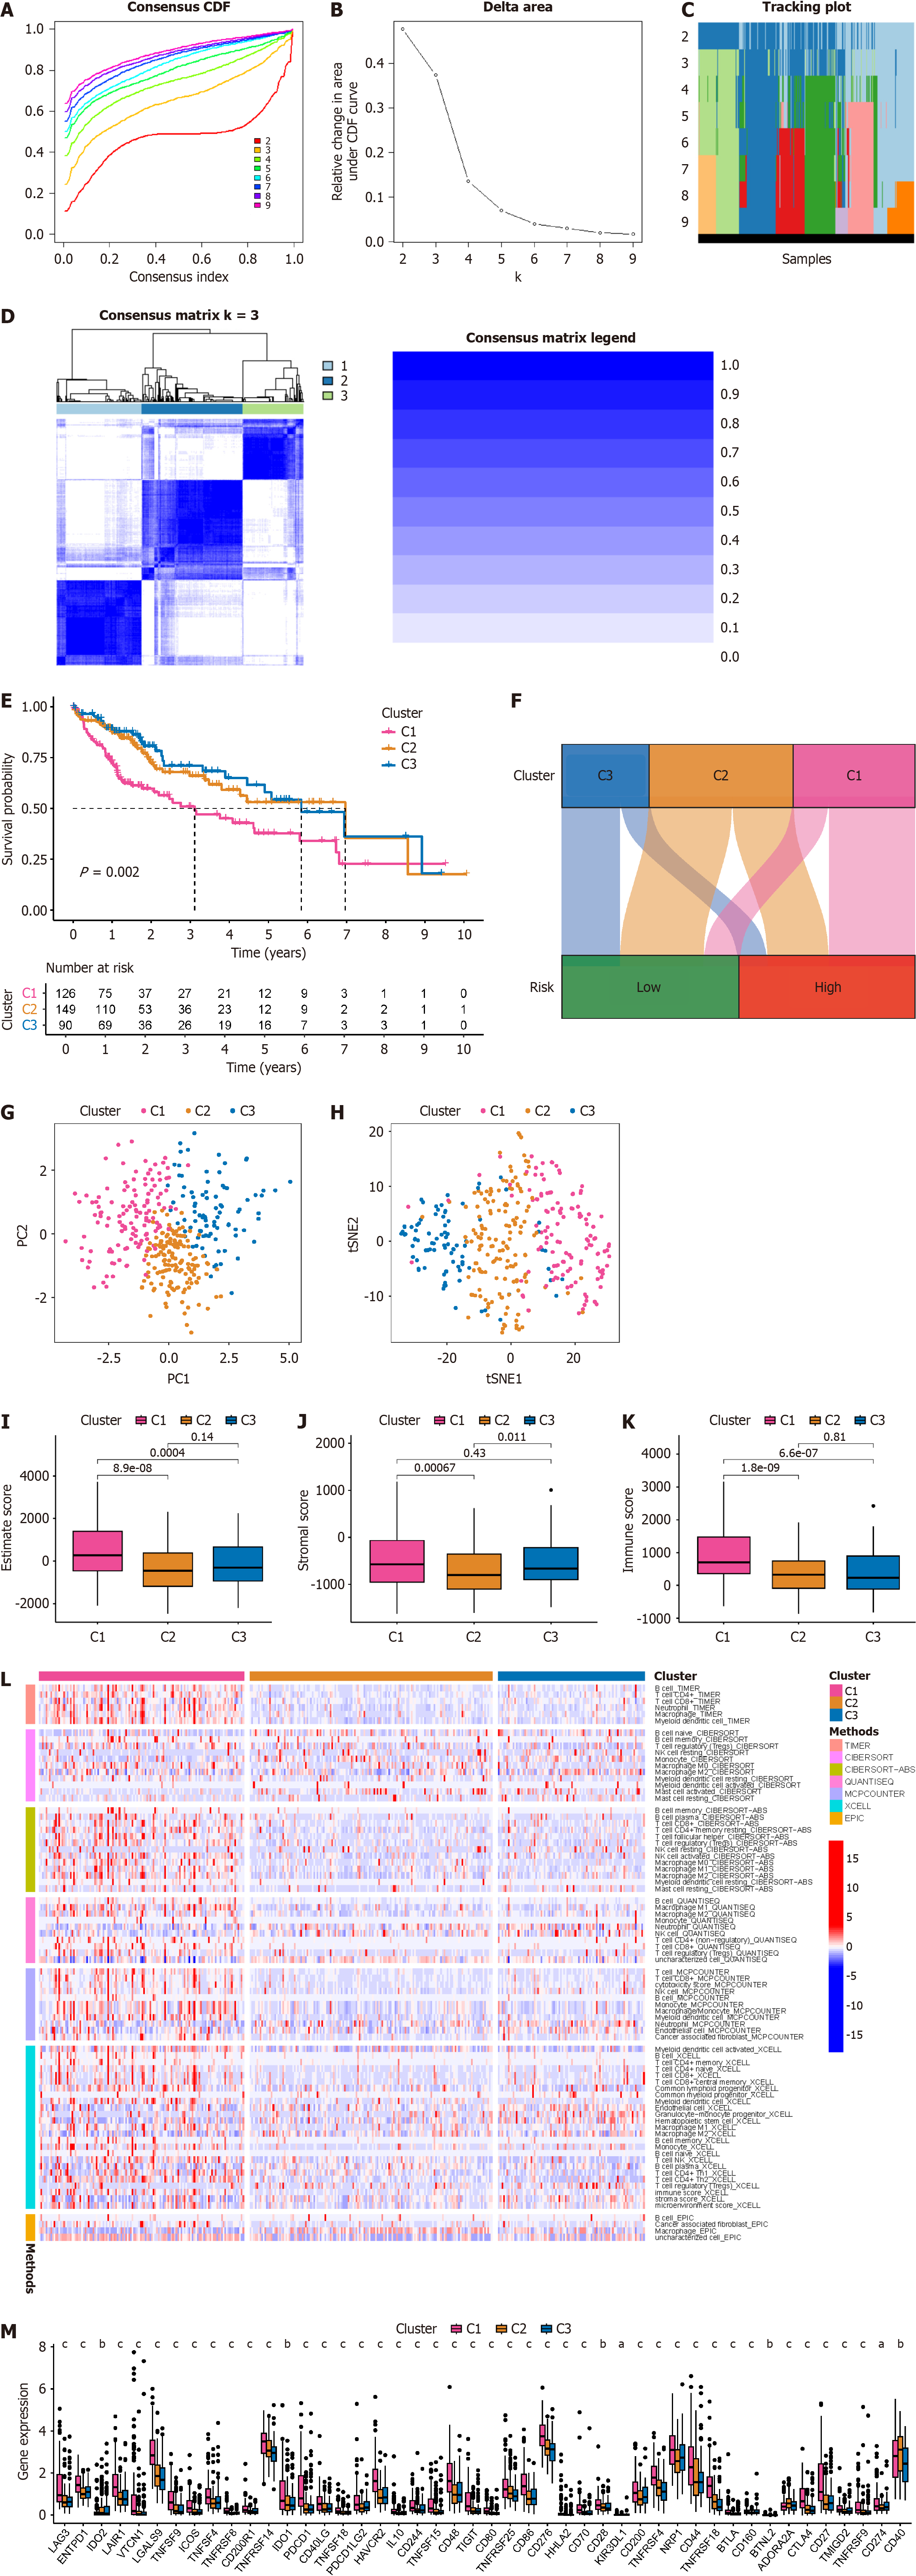
Figure 9 Novel molecular subtyping for identification of hepatocellular carcinoma based on B-cell-related genes.
A: Cumulative distribution function curves for different numbers of classifications, where different curves represent the stability of models at different k values; B: Distribution of samples across different numbers of classifications; C: Heatmap displays distribution of hepatocellular carcinoma (HCC) patients under different k values; D: Consistency clustering plot displays the clustering results when k = 3; E: Survival curves illustrate the prognosis of HCC patients with different molecular subtypes; F: Sankey diagram shows the correspondence between different molecular subtypes of HCC patients and different risk score groups; G: Principal component analysis shows the distribution of samples across different HCC molecular subtypes; H: T-distributed stochastic neighbor embedding analysis shows the distribution of samples across different HCC molecular subtypes; I: Box plot demonstrates the estimate score across different HCC molecular subtypes; J: Box plot showcases the stromal score across different HCC molecular subtypes; K: Box plot displays the immune score across different HCC molecular subtypes; L: Heatmap displays the immune cell infiltration status across different HCC molecular subtypes based on different algorithms; M: Box plot demonstrates the expression of immune checkpoint genes across different HCC molecular subtypes. aP < 0.05; bP < 0.01; cP < 0.001.
- Citation: Xu KQ, Gong Z, Yang JL, Xia CQ, Zhao JY, Chen X. B-cell-specific signatures reveal novel immunophenotyping and therapeutic targets for hepatocellular carcinoma. World J Gastroenterol 2024; 30(34): 3894-3925
- URL: https://www.wjgnet.com/1007-9327/full/v30/i34/3894.htm
- DOI: https://dx.doi.org/10.3748/wjg.v30.i34.3894


