Copyright
©The Author(s) 2024.
World J Gastroenterol. Sep 14, 2024; 30(34): 3894-3925
Published online Sep 14, 2024. doi: 10.3748/wjg.v30.i34.3894
Published online Sep 14, 2024. doi: 10.3748/wjg.v30.i34.3894
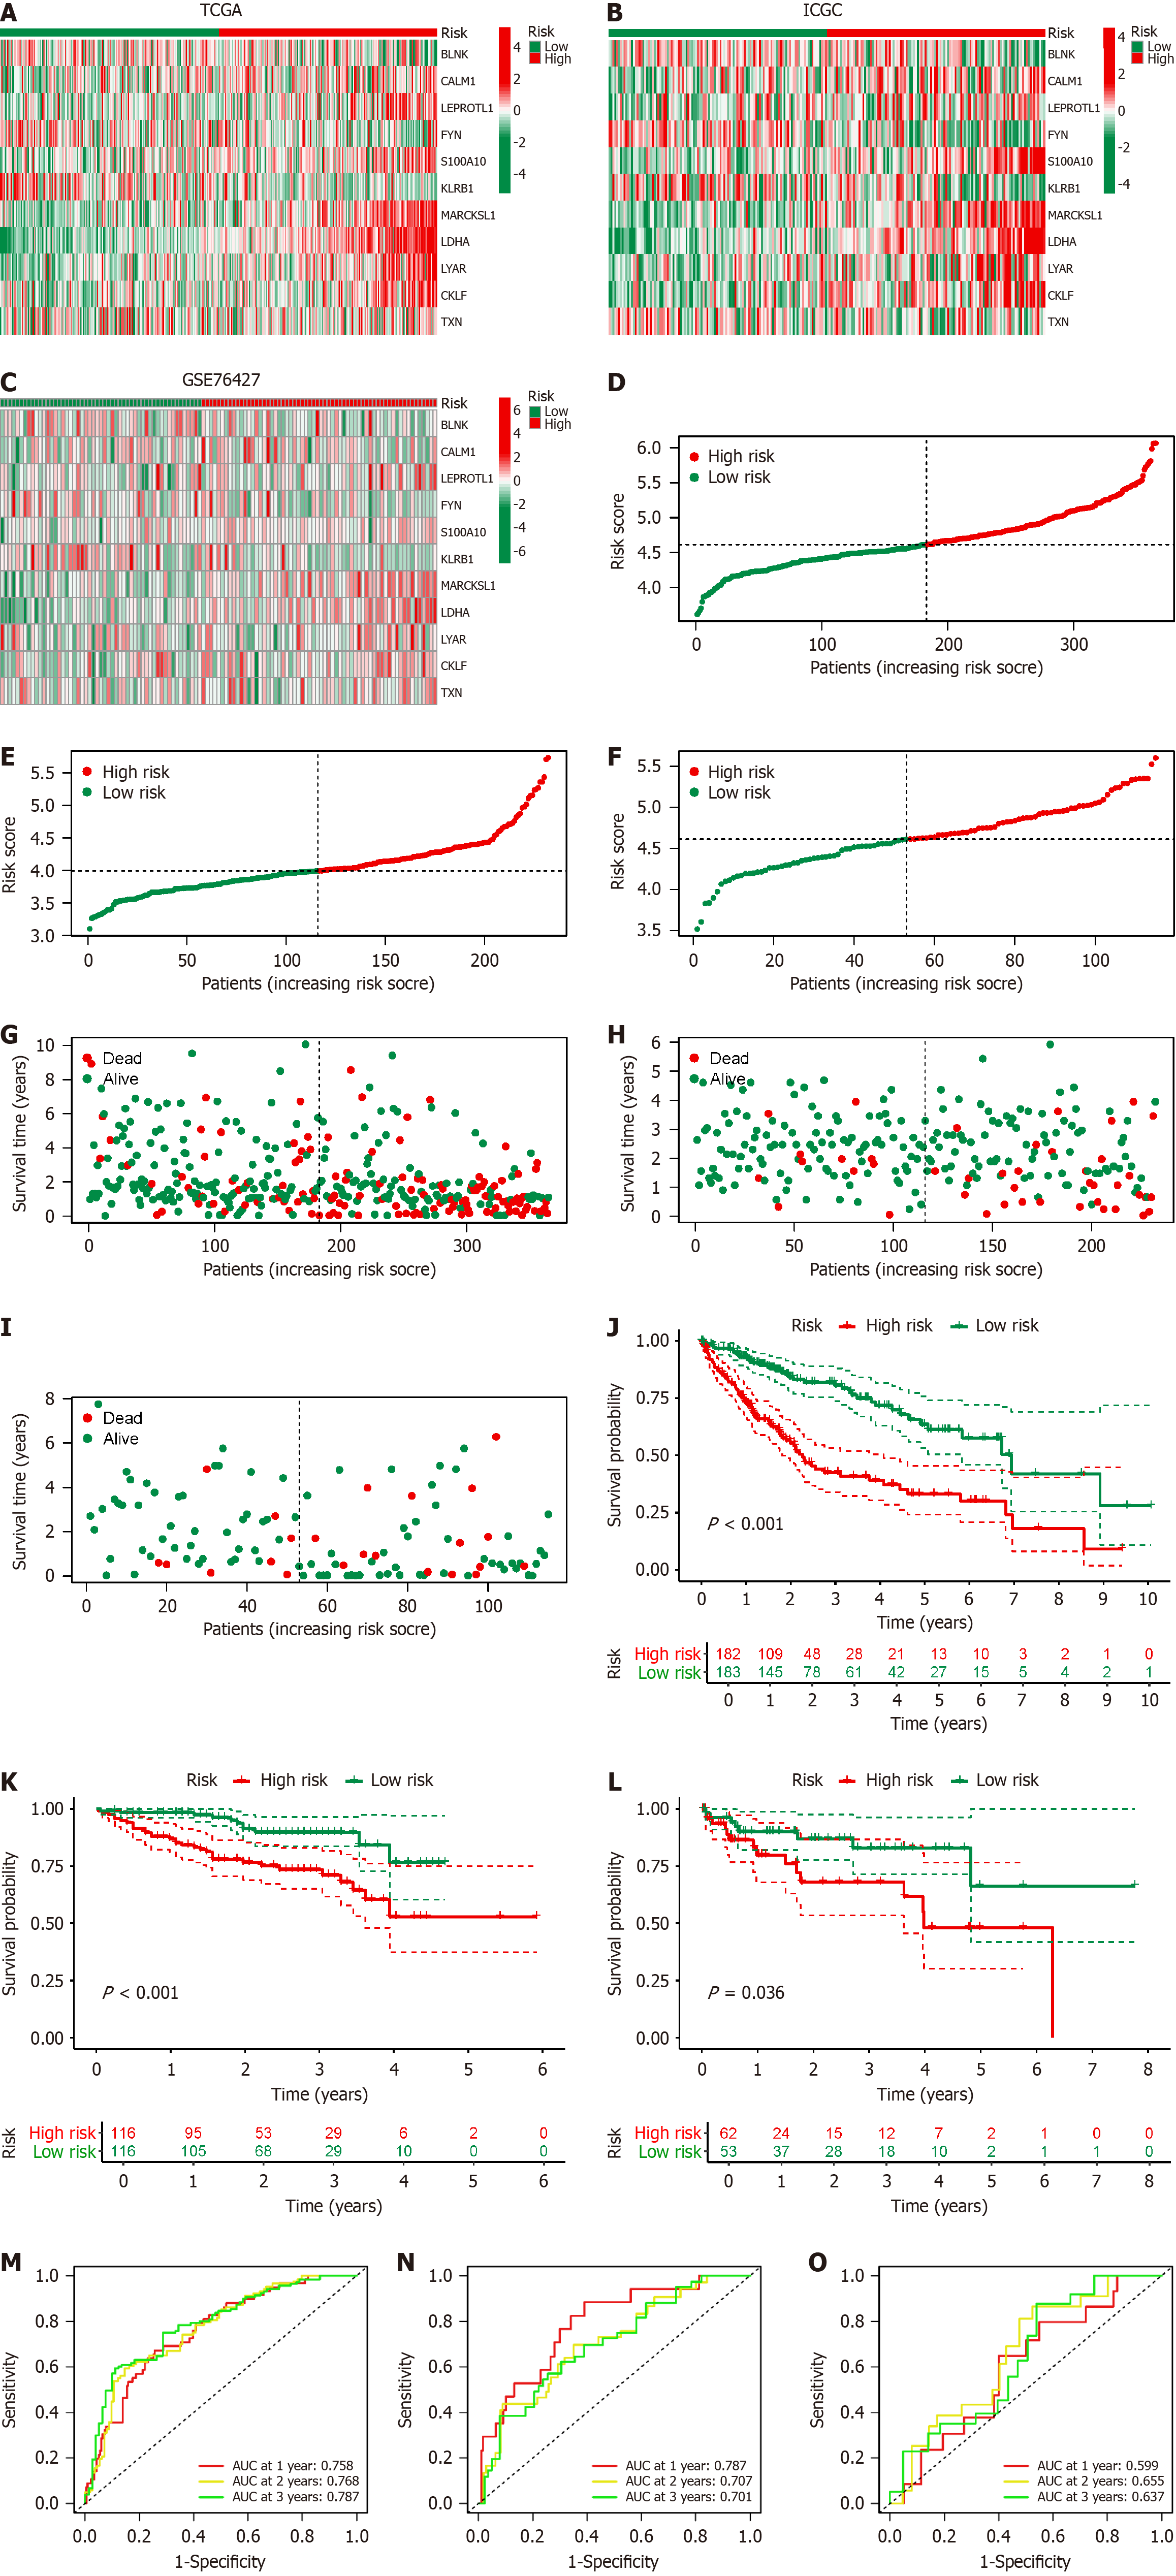
Figure 5 Validation of B-cell-related genes prognostic model in hepatocellular carcinoma.
A–C: Heatmap displays the expression levels of the 11 B-cell-related genes (BRGs) included in the prognostic model in The Cancer Genome Atlas (TCGA) (A); International Cancer Genome Consortium (ICGC) (B); Gene set enrichment (GSE) 76427 (C); D–F: Risk curves depict the distribution of hepatocellular carcinoma (HCC) patients with different risk scores in TCGA (D); ICGC (E); GSE76427 (F); G–I: Dot plots show the distribution of the survival status of HCC patients with different risk scores in TCGA (G); ICGC (H); GSE76427 (I); J–L: Survival curves illustrate the prognosis of HCC patients with different risk scores in TCGA (J); ICGC (K); GSE76427 (L); M–O: Receiver operating characteristic curves demonstrate the predictive efficacy of the BRGs prognostic model in TCGA (M); ICGC (N); GSE76427 (O); AUC: Areas under the curves.
- Citation: Xu KQ, Gong Z, Yang JL, Xia CQ, Zhao JY, Chen X. B-cell-specific signatures reveal novel immunophenotyping and therapeutic targets for hepatocellular carcinoma. World J Gastroenterol 2024; 30(34): 3894-3925
- URL: https://www.wjgnet.com/1007-9327/full/v30/i34/3894.htm
- DOI: https://dx.doi.org/10.3748/wjg.v30.i34.3894


