Copyright
©The Author(s) 2024.
World J Gastroenterol. Aug 21, 2024; 30(31): 3705-3716
Published online Aug 21, 2024. doi: 10.3748/wjg.v30.i31.3705
Published online Aug 21, 2024. doi: 10.3748/wjg.v30.i31.3705
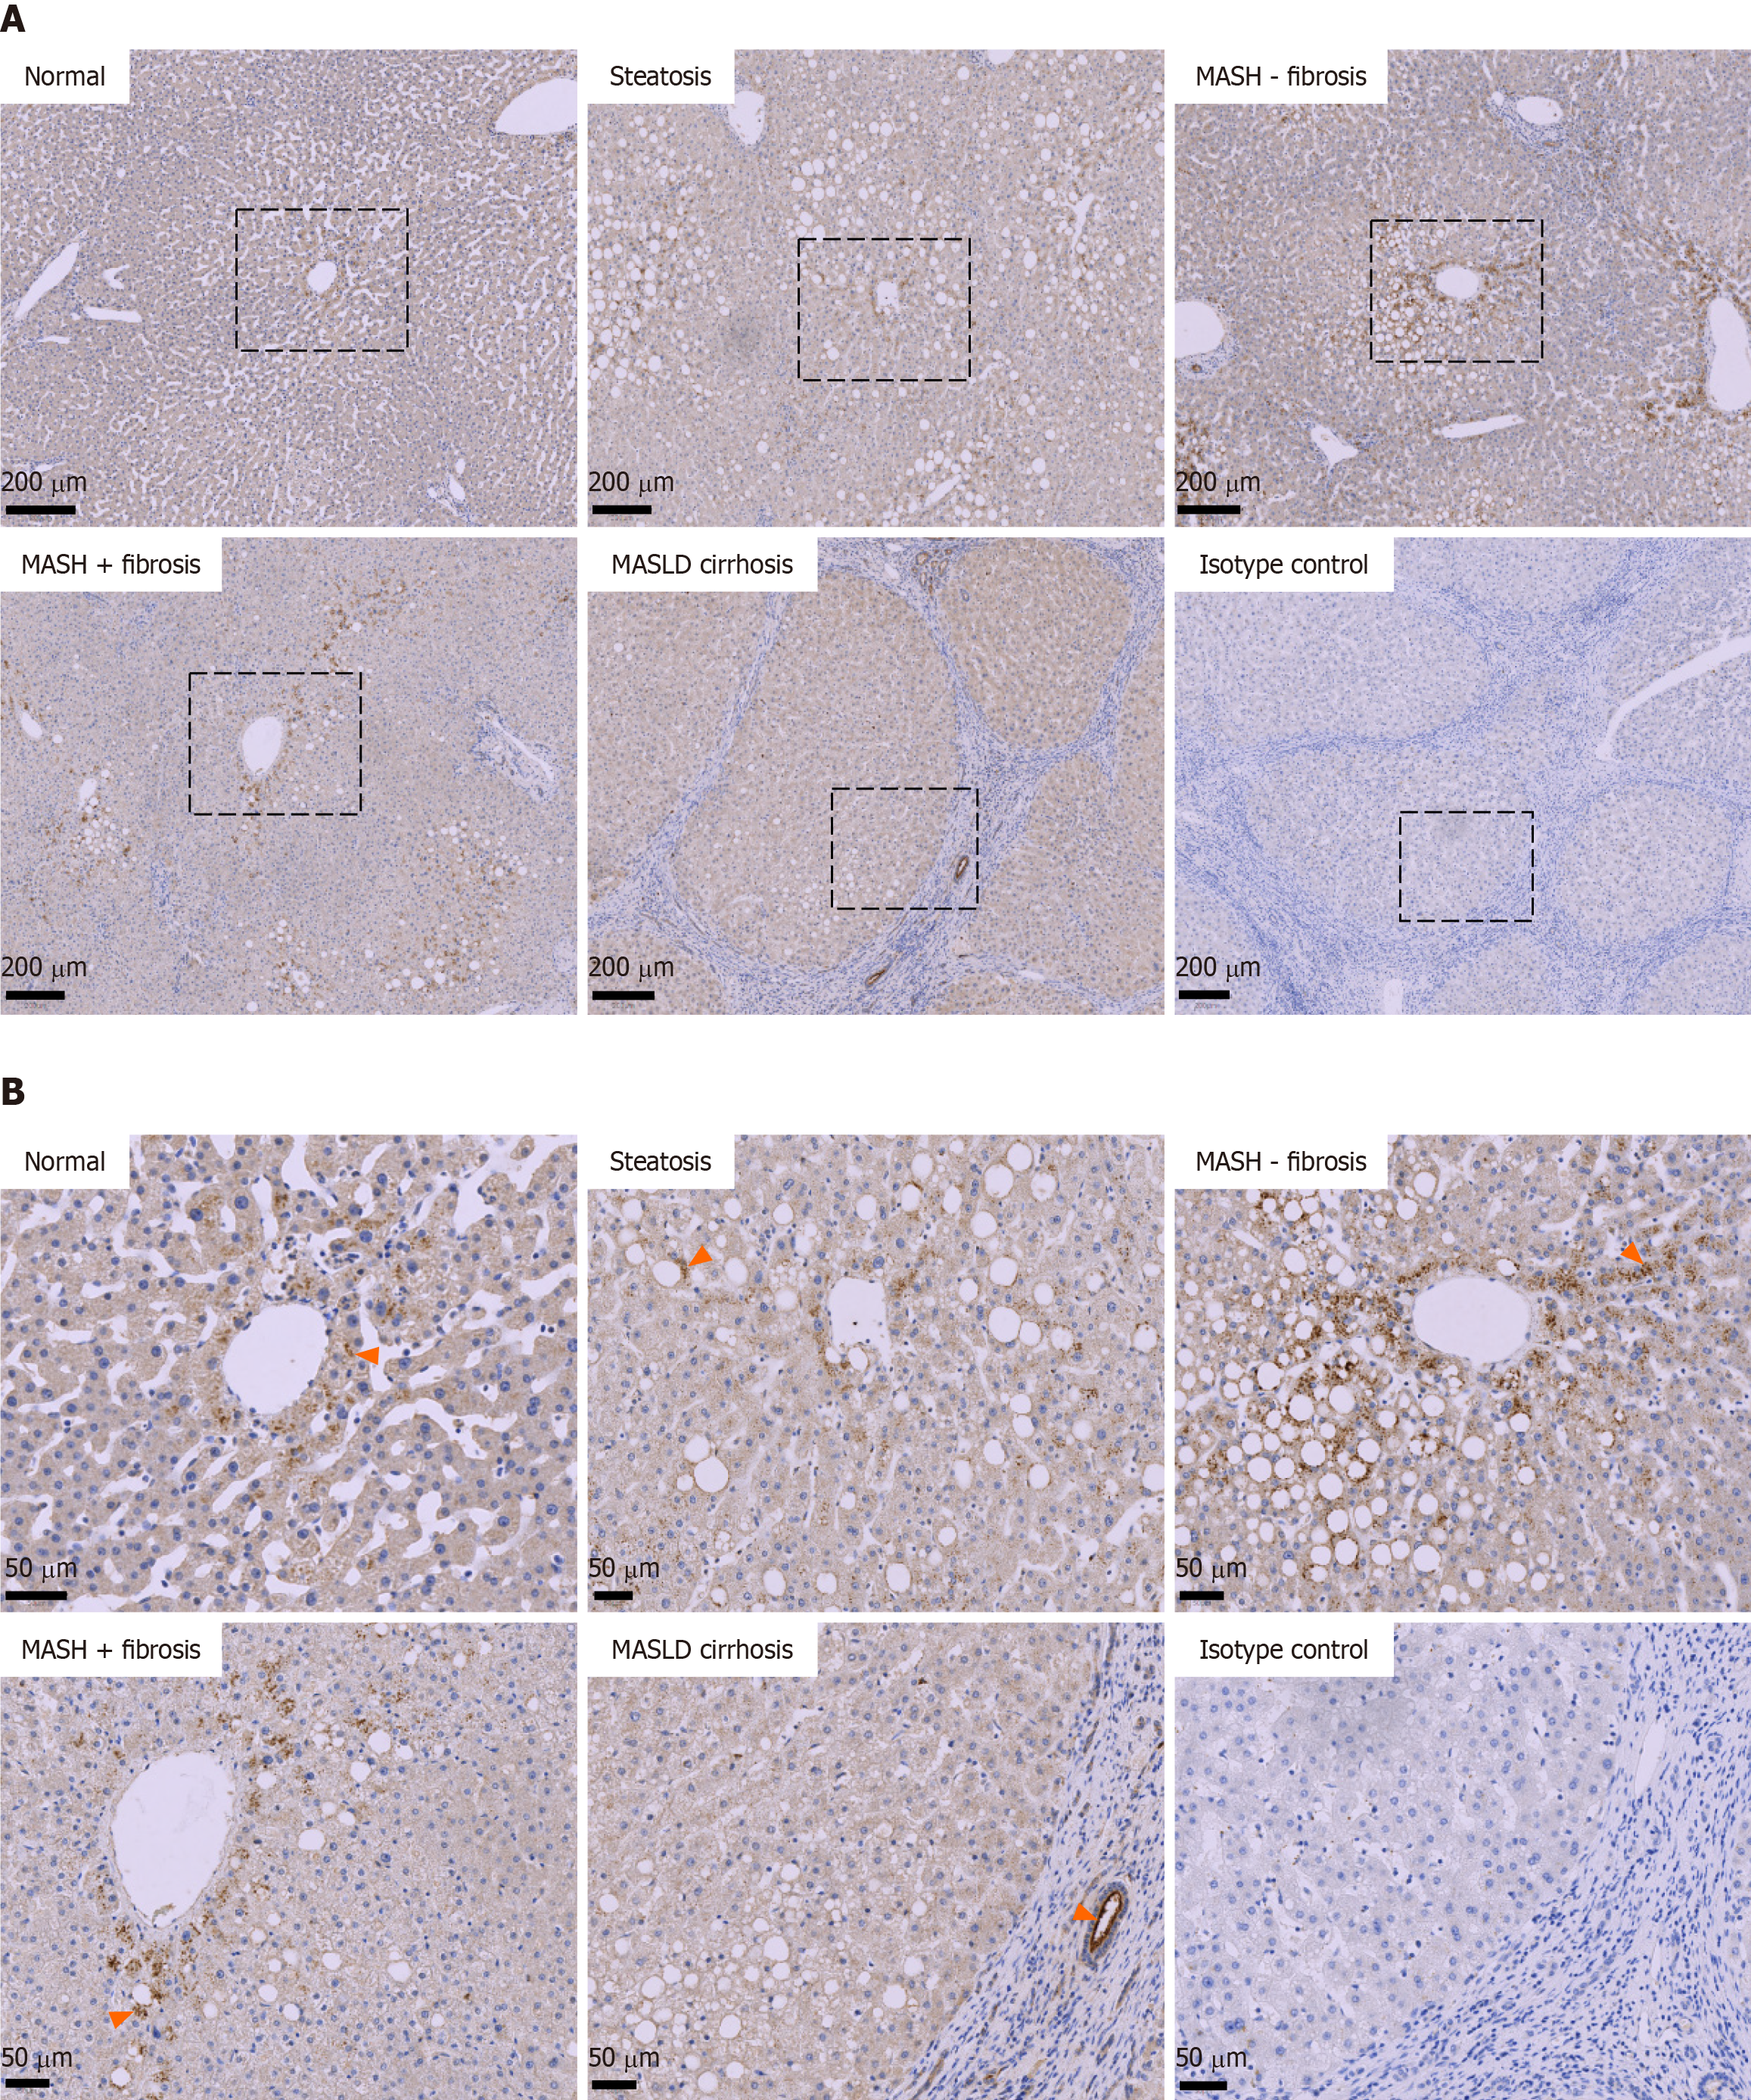
Figure 1 Angiotensin-converting enzyme 2 protein expression pattern in normal and metabolic dysfunction-associated steatotic liver disease livers.
A: Representative images of angiotensin-converting enzyme 2 immunostaining across the metabolic dysfunction-associated steatotic liver disease histological spectrum. Scale bars: 200 µm; B: Representative views of boxed areas in panel A (positive and specific staining is indicated with arrowheads). Scale bars: 50 µm. MASH: Metabolic dysfunction-associated steatohepatitis; MASLD: Metabolic dysfunction-associated steatotic liver disease.
- Citation: Jacobs AK, Morley SD, Samuel K, Morgan K, Boswell L, Kendall TJ, Dorward DA, Fallowfield JA, Hayes PC, Plevris JN. Hepatic angiotensin-converting enzyme 2 expression in metabolic dysfunction-associated steatotic liver disease and in patients with fatal COVID-19. World J Gastroenterol 2024; 30(31): 3705-3716
- URL: https://www.wjgnet.com/1007-9327/full/v30/i31/3705.htm
- DOI: https://dx.doi.org/10.3748/wjg.v30.i31.3705


