Copyright
©The Author(s) 2024.
World J Gastroenterol. Aug 14, 2024; 30(30): 3609-3624
Published online Aug 14, 2024. doi: 10.3748/wjg.v30.i30.3609
Published online Aug 14, 2024. doi: 10.3748/wjg.v30.i30.3609
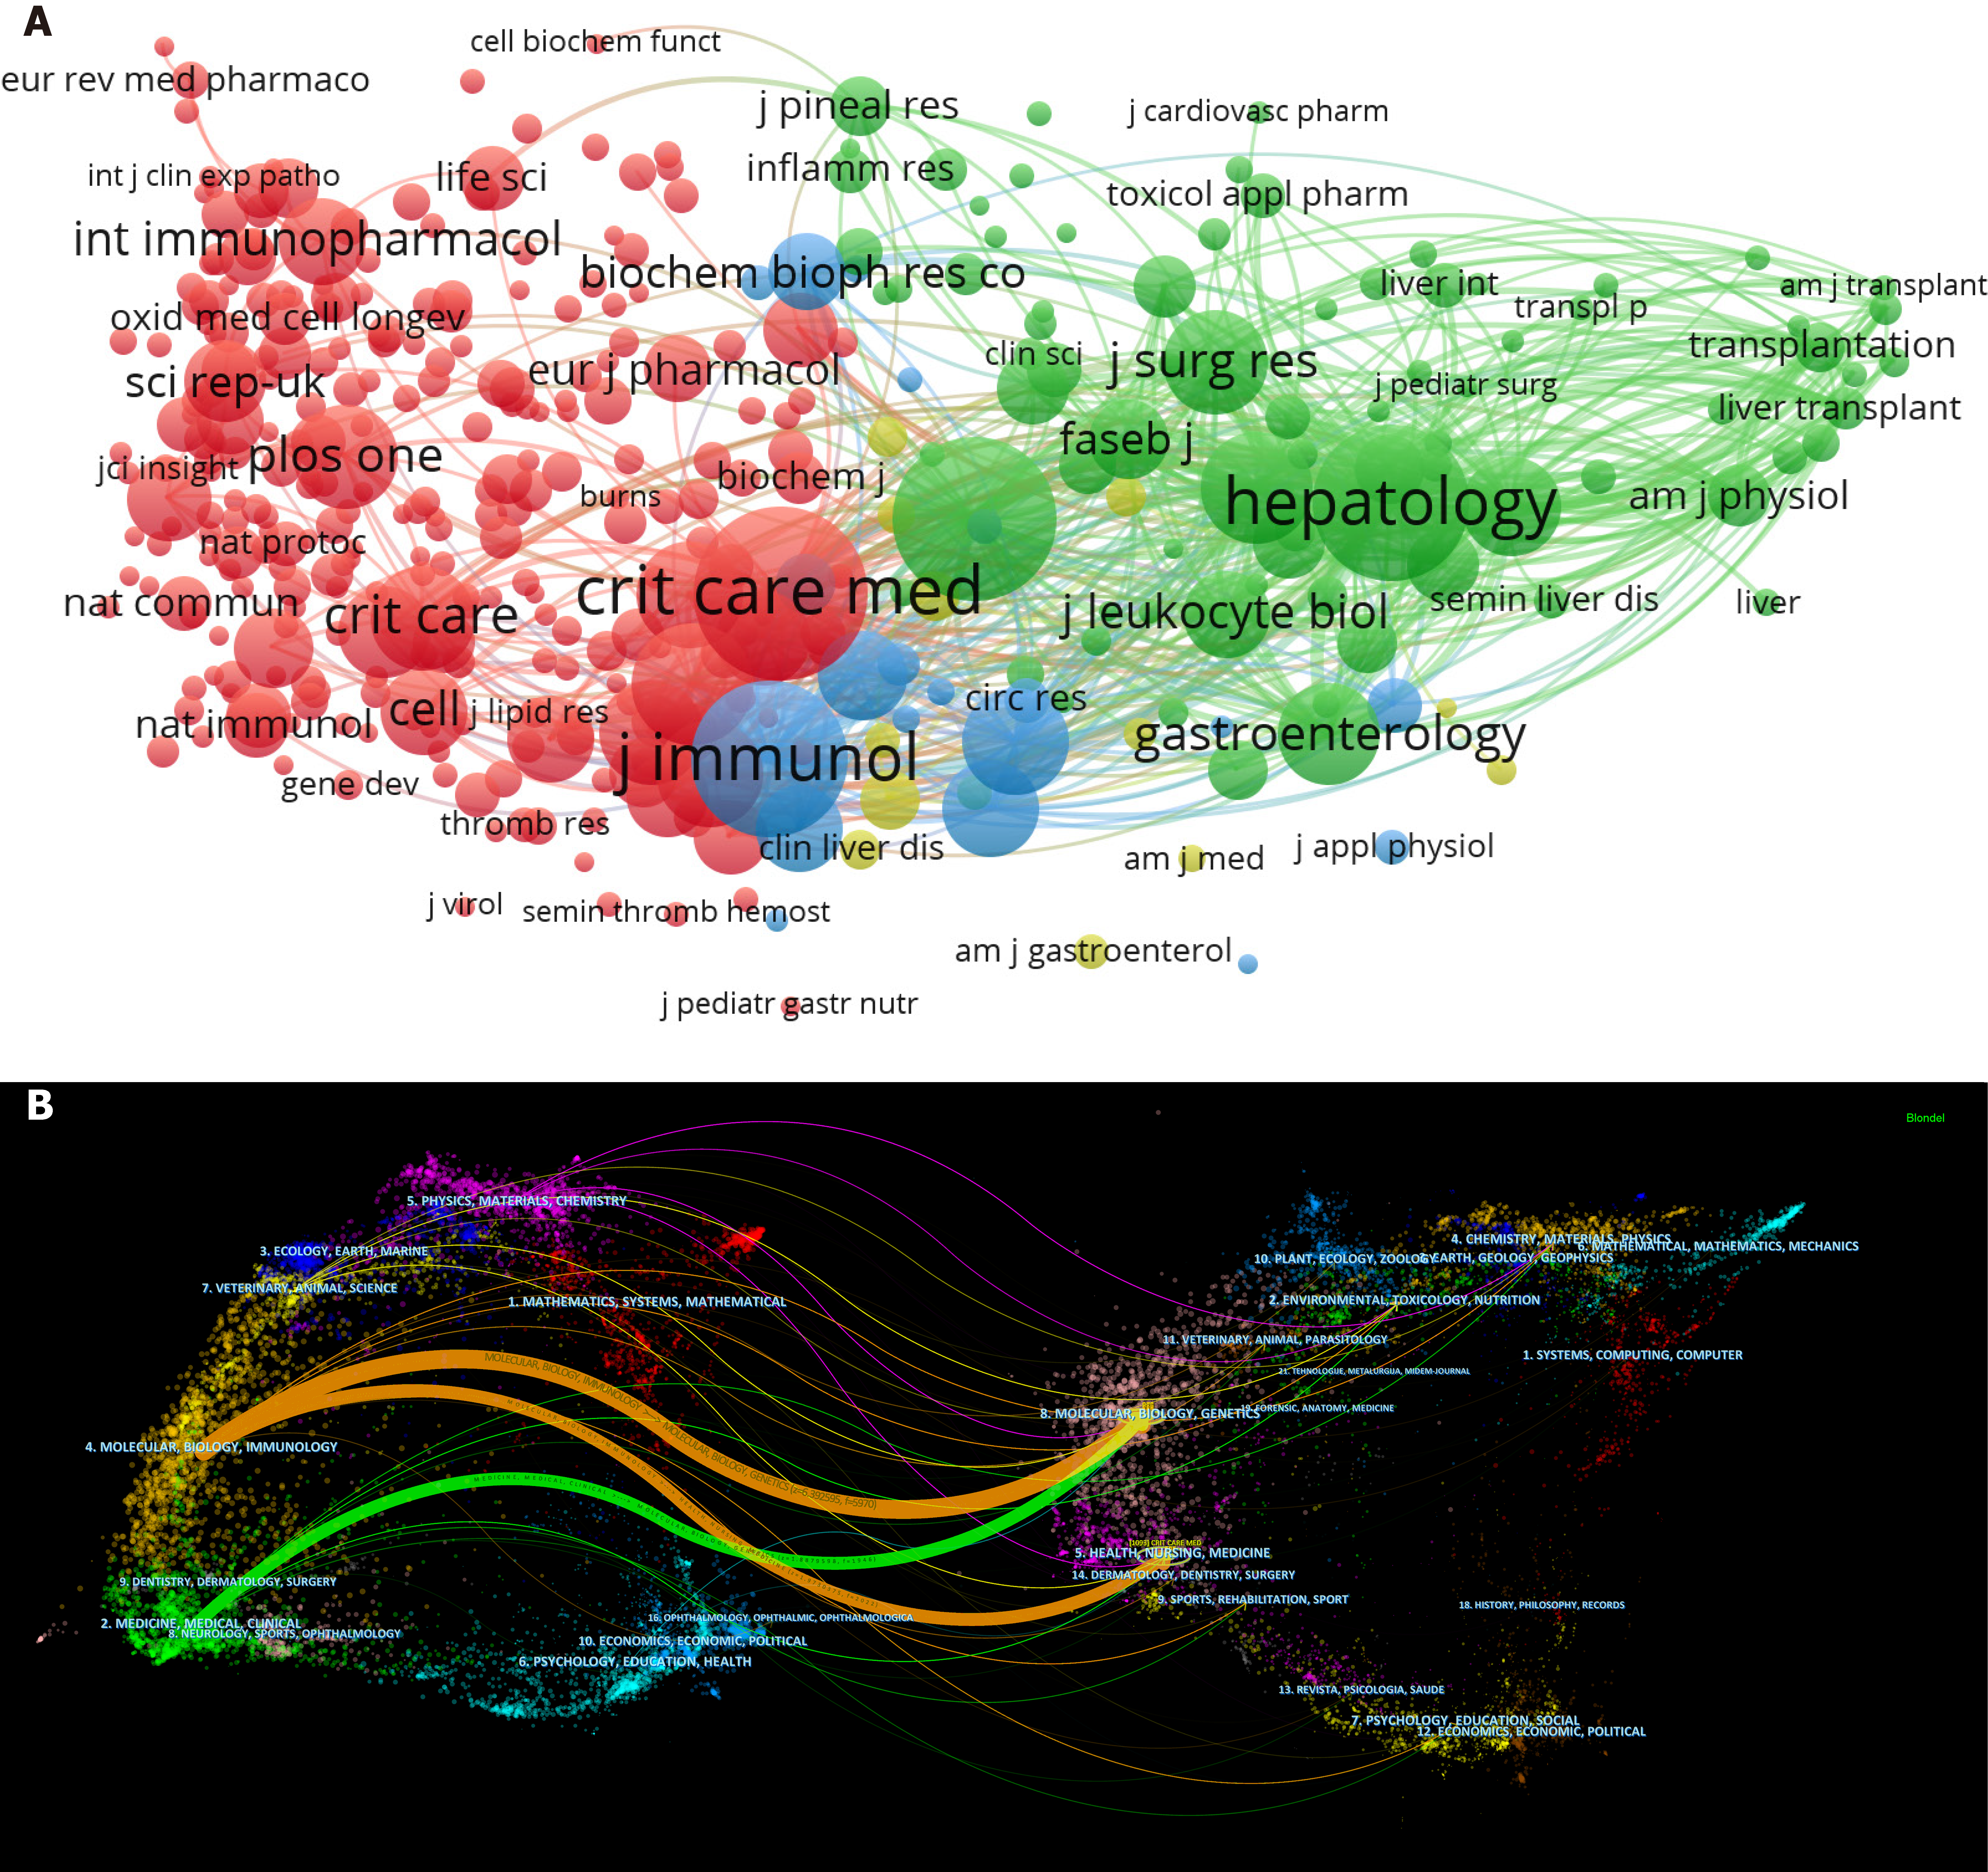
Figure 5 Journal analysis.
A: Co-citation map of journal with the threshold of 15 times. Each node represents a journal; B: Dual-map overlay of journals in which research was published (left) or cited (right). Colors distinguished the disciplines, and the thickness of the lines represented a closer alignment in research content.
- Citation: Zhang Z, Tan XJ, Shi HQ, Zhang H, Li JB, Liao XL. Bibliometric study of sepsis-associated liver injury from 2000 to 2023. World J Gastroenterol 2024; 30(30): 3609-3624
- URL: https://www.wjgnet.com/1007-9327/full/v30/i30/3609.htm
- DOI: https://dx.doi.org/10.3748/wjg.v30.i30.3609


