Copyright
©The Author(s) 2024.
World J Gastroenterol. Aug 7, 2024; 30(29): 3511-3533
Published online Aug 7, 2024. doi: 10.3748/wjg.v30.i29.3511
Published online Aug 7, 2024. doi: 10.3748/wjg.v30.i29.3511
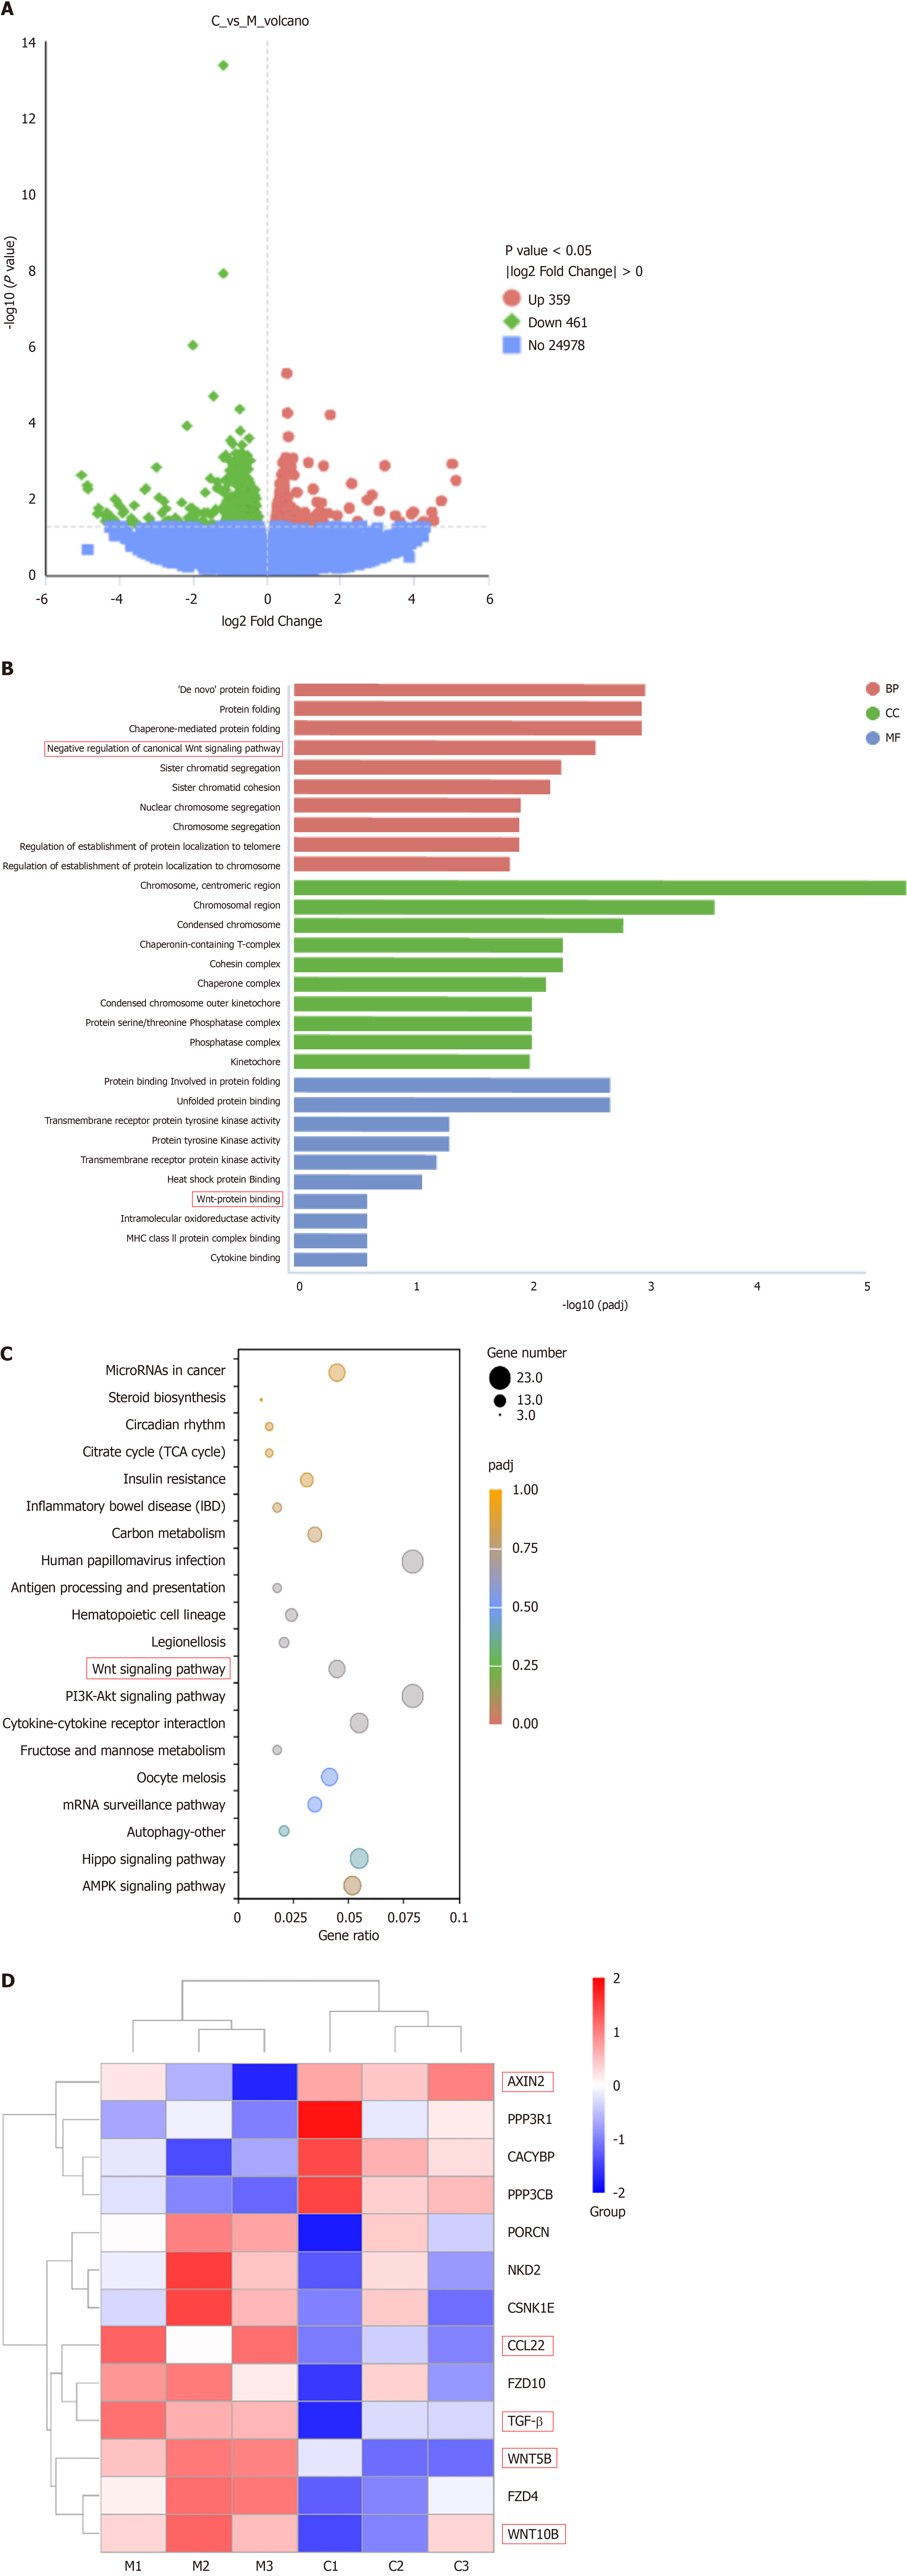
Figure 4 Differentially expressed genes between Calculus bovis-treated group and control group (q < 0.
05 and log2FlodChange > 0) after transcriptome sequences were analyzed by bioinformatics. A: Differential gene volcano plot between the Calculus bovis (CB)-treated and control groups; B: Histogram of Gene Ontology enrichment results of differentially expressed mRNAs in the CB-treated and control groups (top 10); C: Bubble plots of Kyoto Encyclopedia of Genes and Genomes enrichment results of differentially expressed mRNAs in the CB-treated and control groups (top 20); D: Heatmap of selected genes involved in the Wnt pathway.
- Citation: Huang Z, Meng FY, Lu LZ, Guo QQ, Lv CJ, Tan NH, Deng Z, Chen JY, Zhang ZS, Zou B, Long HP, Zhou Q, Tian S, Mei S, Tian XF. Calculus bovis inhibits M2 tumor-associated macrophage polarization via Wnt/β-catenin pathway modulation to suppress liver cancer. World J Gastroenterol 2024; 30(29): 3511-3533
- URL: https://www.wjgnet.com/1007-9327/full/v30/i29/3511.htm
- DOI: https://dx.doi.org/10.3748/wjg.v30.i29.3511


