Copyright
©The Author(s) 2024.
World J Gastroenterol. Aug 7, 2024; 30(29): 3511-3533
Published online Aug 7, 2024. doi: 10.3748/wjg.v30.i29.3511
Published online Aug 7, 2024. doi: 10.3748/wjg.v30.i29.3511
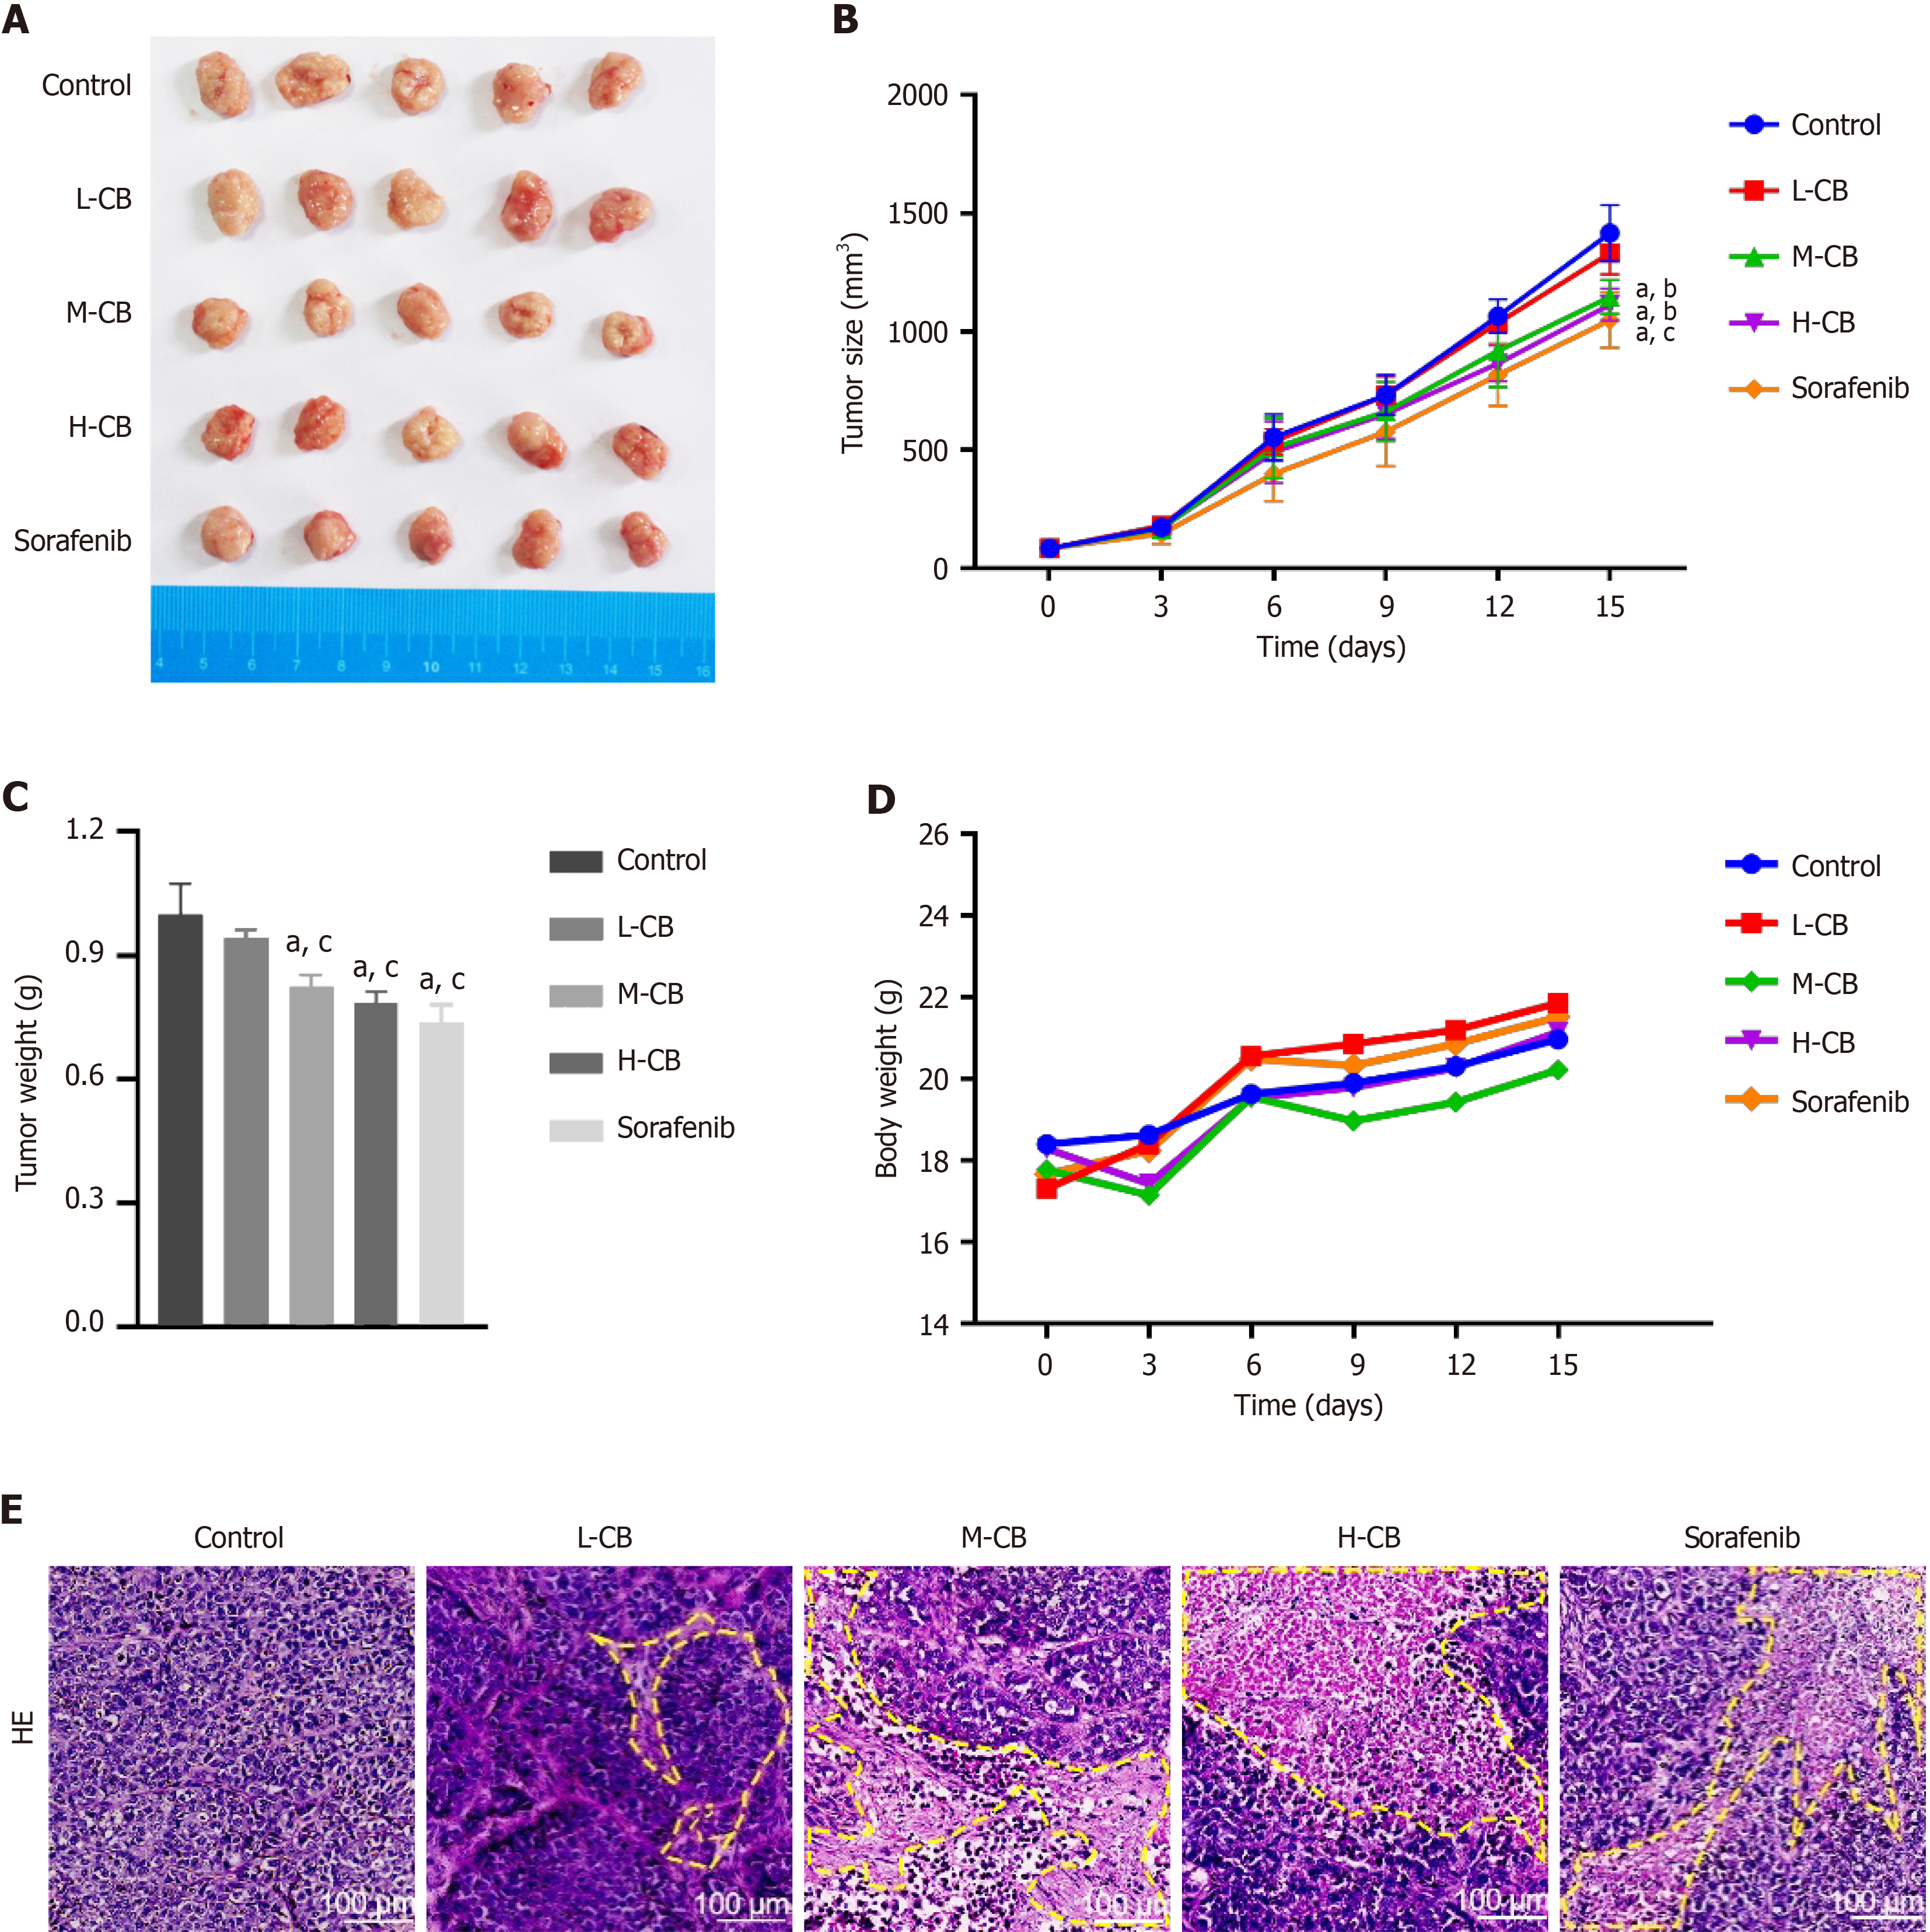
Figure 2 In vivo anti-tumor activity of Calculus bovis.
A: Pictures of tumors in each group after treatment; B: Tumor size changes in each group during treatment; C: Tumor weight of each group during treatment; D: Changes in weight of mice in each group during treatment; E: Hematoxylin-eosin staining results of tumor tissue sections in each group after treatment. Control: Model group. CB: Calculus bovis; L-CB: Low-dose CB group; M-CB: Medium-dose CB group; H-CB: High-dose CB group; Differences were assessed using one-way ANOVA and multiple comparisons were determined using Tukey's test. aP < 0.01 vs control, bP < 0.05 vs L-CB, cP < 0.01 vs L-CB.
- Citation: Huang Z, Meng FY, Lu LZ, Guo QQ, Lv CJ, Tan NH, Deng Z, Chen JY, Zhang ZS, Zou B, Long HP, Zhou Q, Tian S, Mei S, Tian XF. Calculus bovis inhibits M2 tumor-associated macrophage polarization via Wnt/β-catenin pathway modulation to suppress liver cancer. World J Gastroenterol 2024; 30(29): 3511-3533
- URL: https://www.wjgnet.com/1007-9327/full/v30/i29/3511.htm
- DOI: https://dx.doi.org/10.3748/wjg.v30.i29.3511


