Copyright
©The Author(s) 2024.
World J Gastroenterol. Aug 7, 2024; 30(29): 3488-3510
Published online Aug 7, 2024. doi: 10.3748/wjg.v30.i29.3488
Published online Aug 7, 2024. doi: 10.3748/wjg.v30.i29.3488
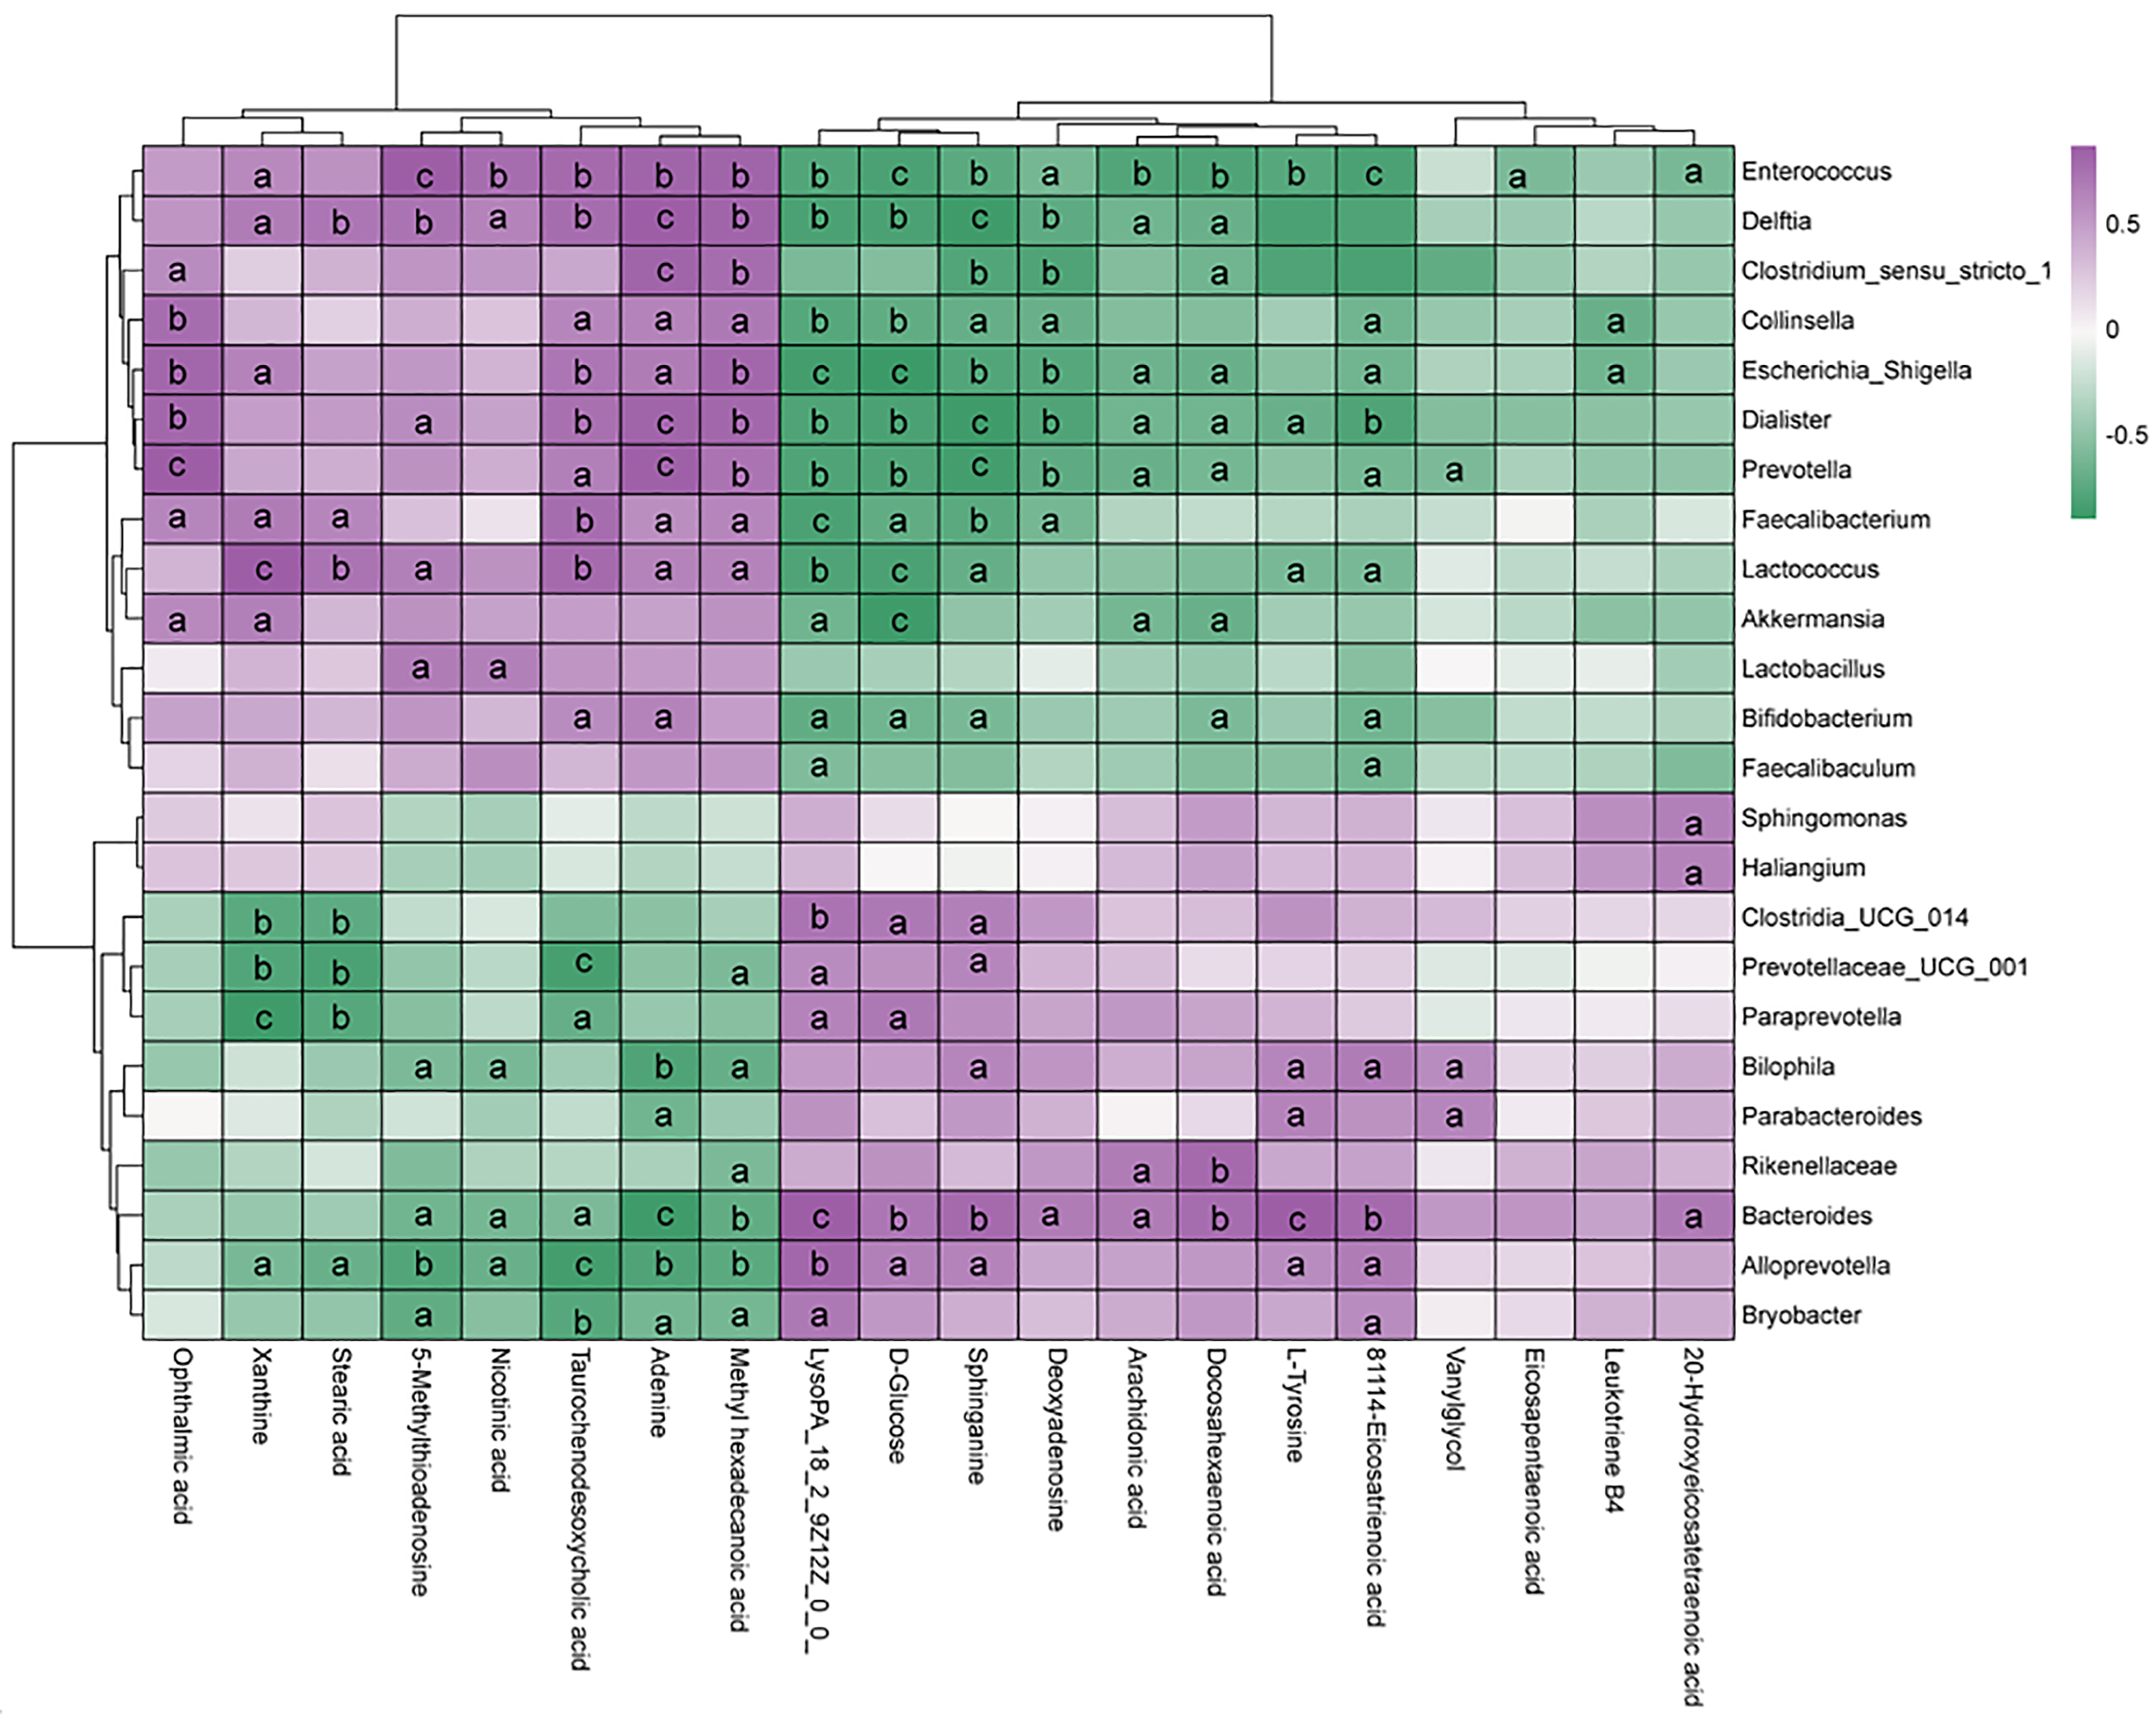
Figure 8 Correlation analysis between the gut microbiota and metabolites from hyperuricemia and leech Poecilobdella manillensis total protein extract groups.
The R values are represented by gradient colors, where purple cells indicate positive correlations and green cells indicate negative correlations, respectively. Statistical significance is denoted as follows: aP < 0.05, bP < 0.01, cP < 0.001.
- Citation: Liu X, Liang XQ, Lu TC, Feng Z, Zhang M, Liao NQ, Zhang FL, Wang B, Wang LS. Leech Poecilobdella manillensis protein extract ameliorated hyperuricemia by restoring gut microbiota dysregulation and affecting serum metabolites. World J Gastroenterol 2024; 30(29): 3488-3510
- URL: https://www.wjgnet.com/1007-9327/full/v30/i29/3488.htm
- DOI: https://dx.doi.org/10.3748/wjg.v30.i29.3488


