Copyright
©The Author(s) 2024.
World J Gastroenterol. Aug 7, 2024; 30(29): 3488-3510
Published online Aug 7, 2024. doi: 10.3748/wjg.v30.i29.3488
Published online Aug 7, 2024. doi: 10.3748/wjg.v30.i29.3488
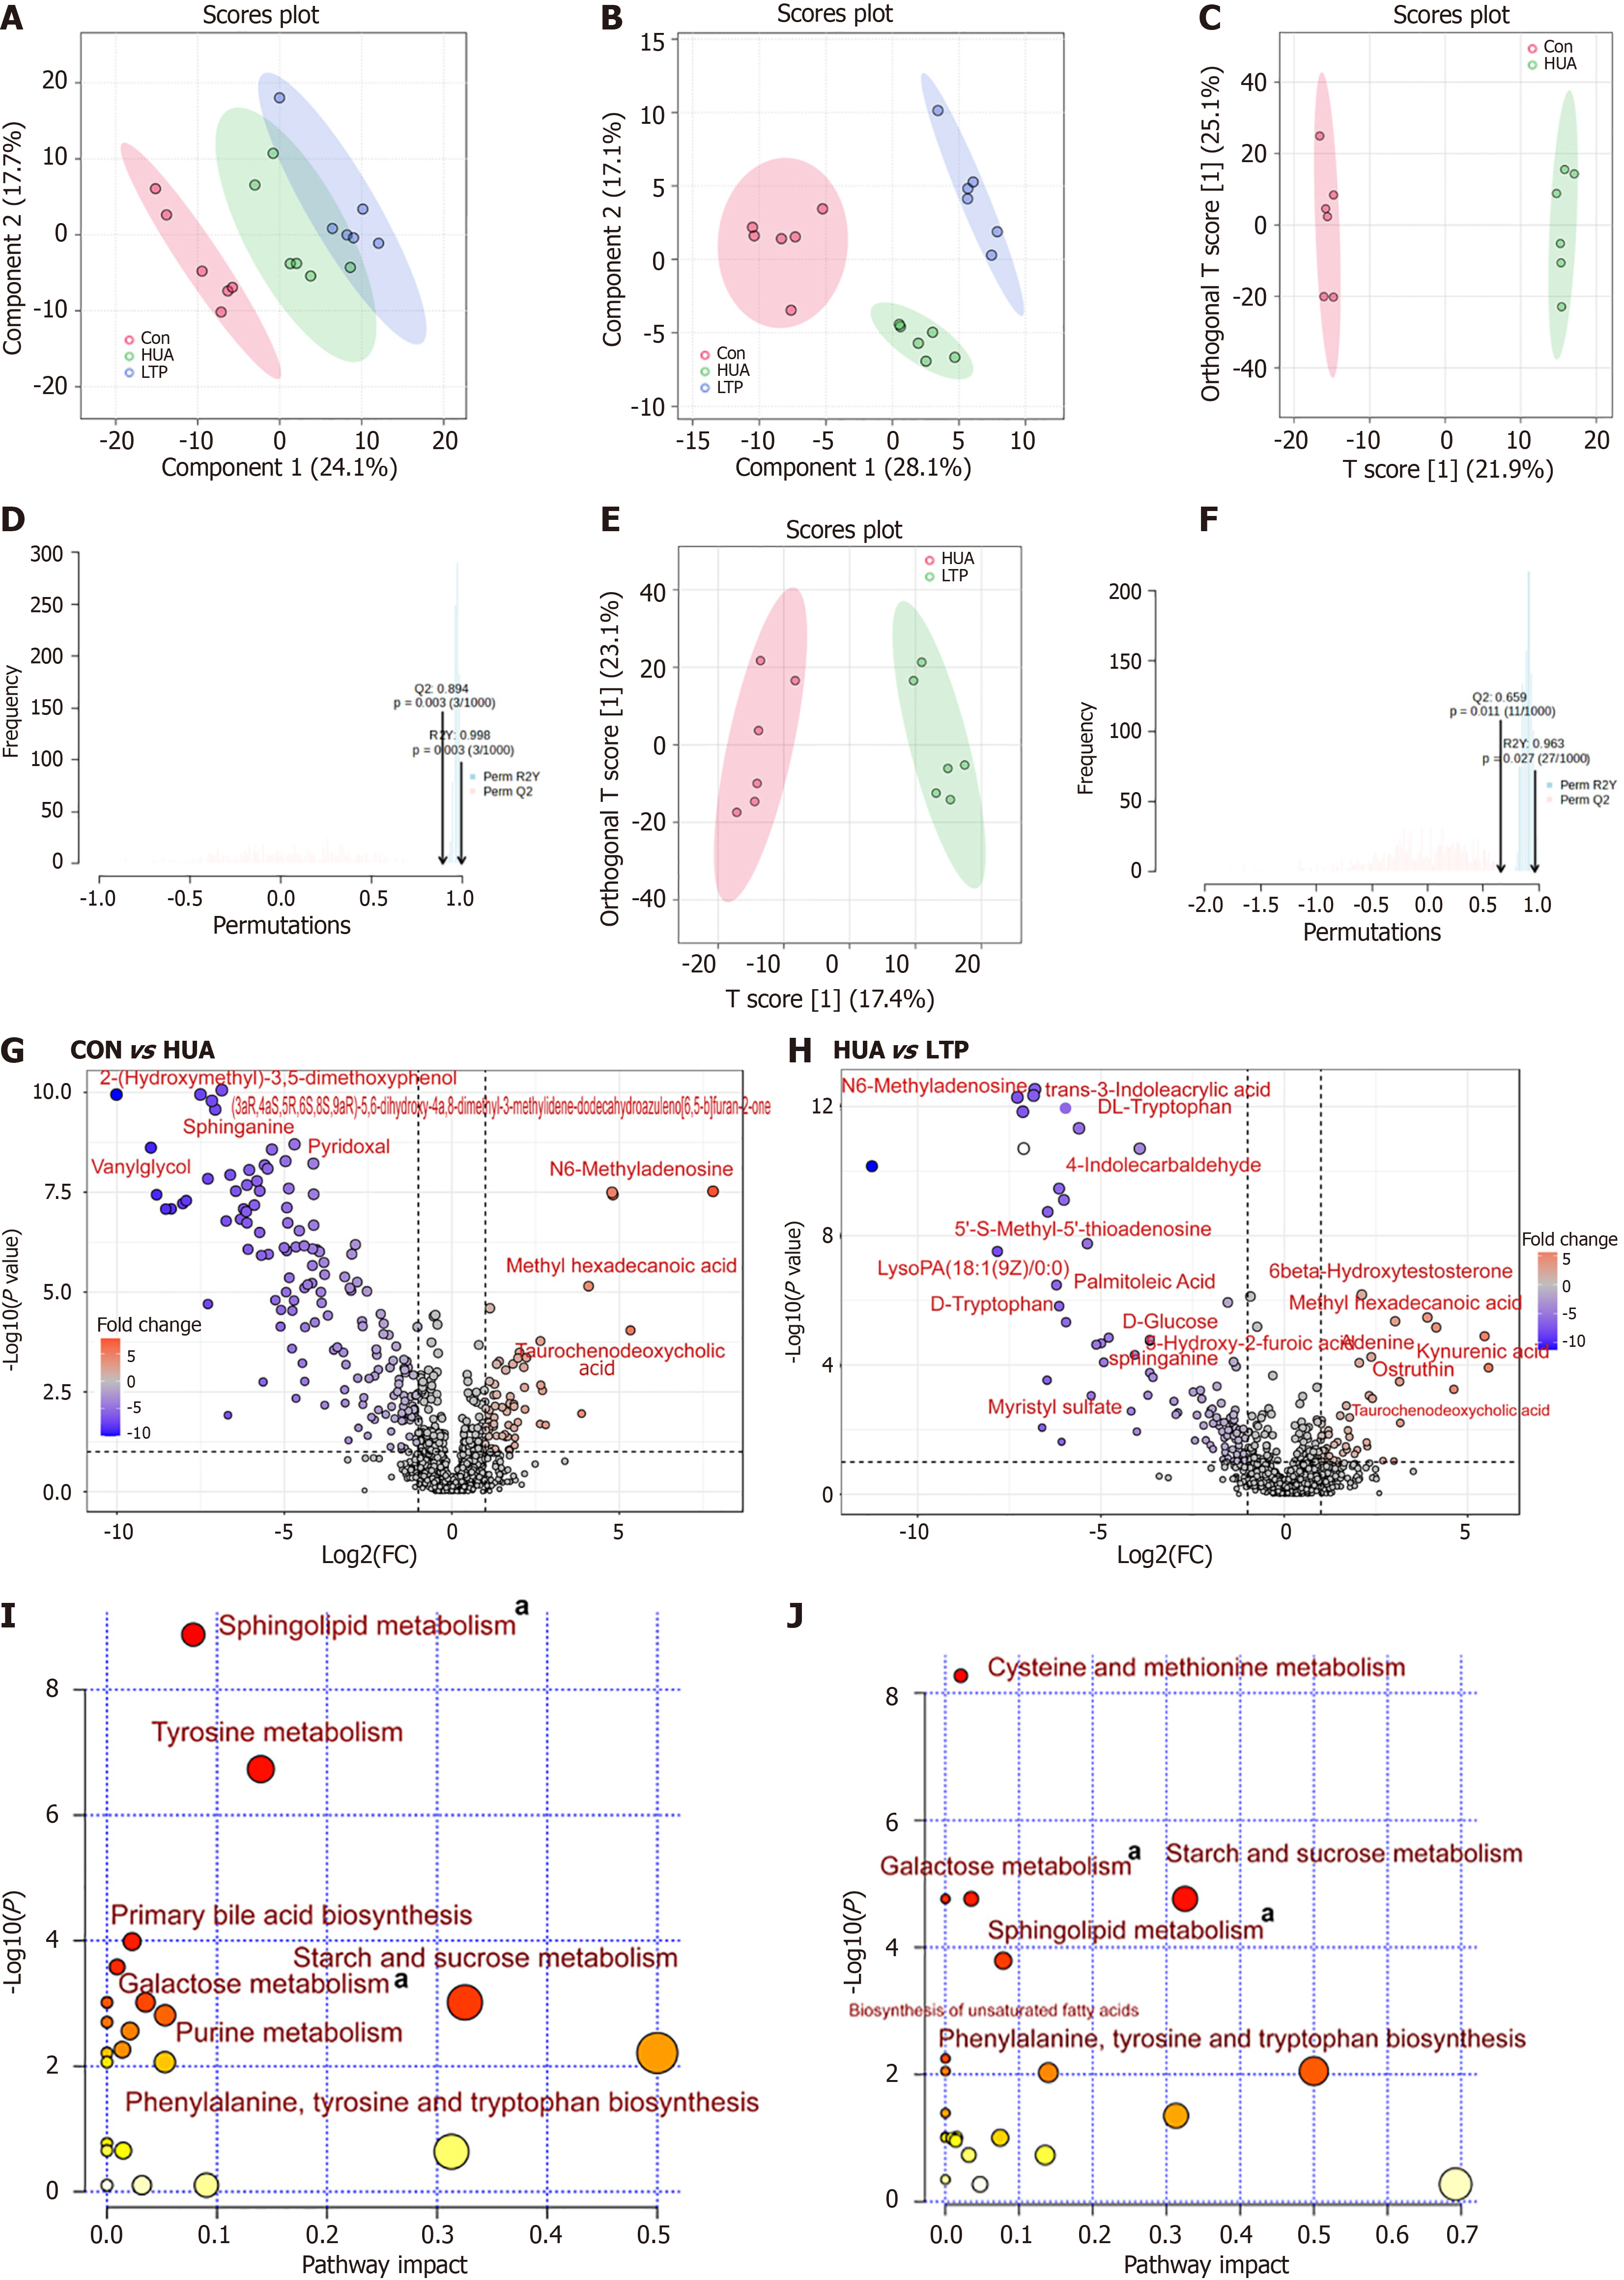
Figure 6 Leech Poecilobdella manillensis total protein extract alters the plasma metabolites in potassium oxonate-induced hyper
- Citation: Liu X, Liang XQ, Lu TC, Feng Z, Zhang M, Liao NQ, Zhang FL, Wang B, Wang LS. Leech Poecilobdella manillensis protein extract ameliorated hyperuricemia by restoring gut microbiota dysregulation and affecting serum metabolites. World J Gastroenterol 2024; 30(29): 3488-3510
- URL: https://www.wjgnet.com/1007-9327/full/v30/i29/3488.htm
- DOI: https://dx.doi.org/10.3748/wjg.v30.i29.3488


