Copyright
©The Author(s) 2024.
World J Gastroenterol. Aug 7, 2024; 30(29): 3479-3487
Published online Aug 7, 2024. doi: 10.3748/wjg.v30.i29.3479
Published online Aug 7, 2024. doi: 10.3748/wjg.v30.i29.3479
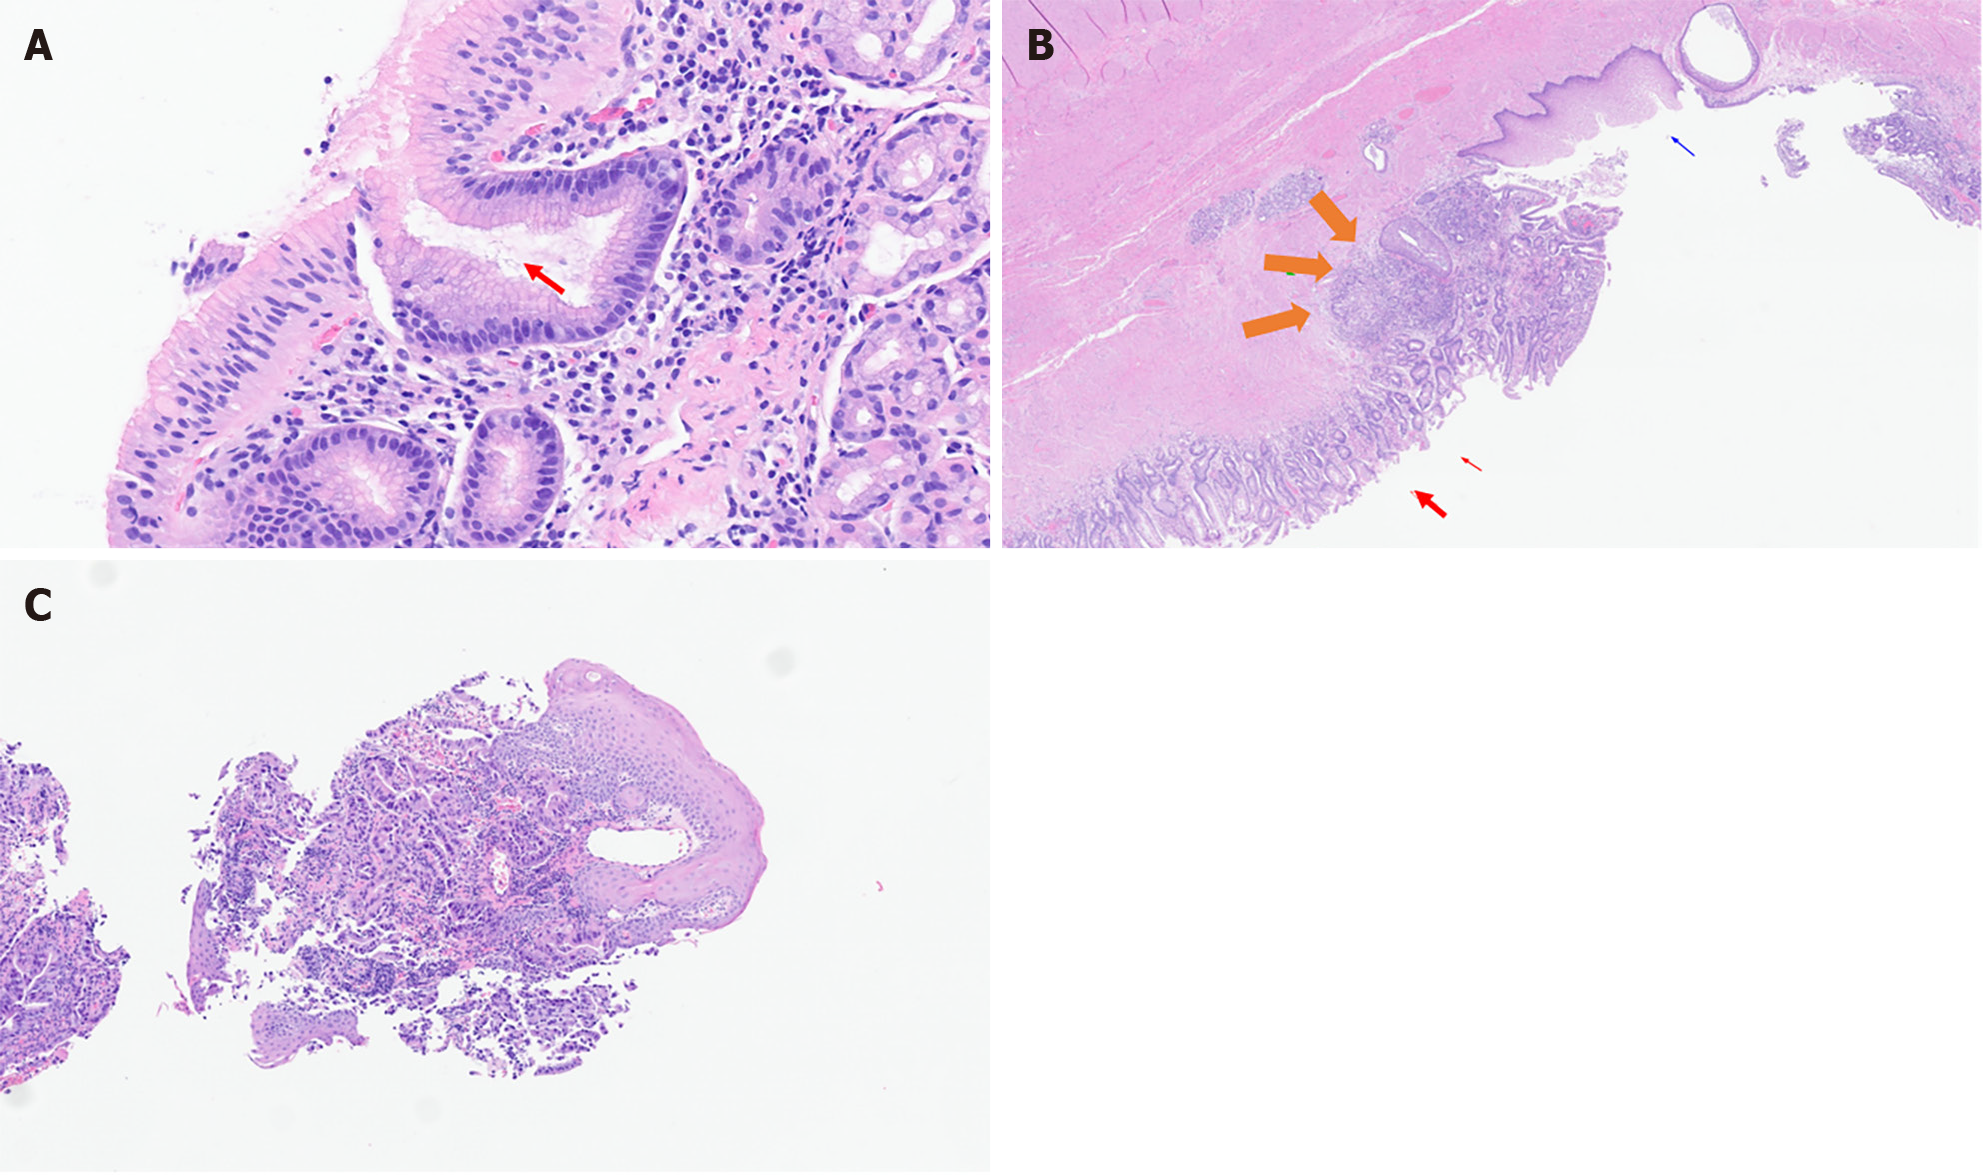
Figure 2 Gastroesophageal junction and esophageal tumors.
A: Red arrow shows Helicobacter pylori in the lumen of an esophageal gland; B: Gastroesophageal junction (GEJ) tumor. Blue arrow shows squamous cells in normal esophageal tumors. Red arrows show Barrett’s esophagus. Orange arrows show GEJ adenocarcinoma; C: Esophageal adenocarcinoma.
- Citation: López-Gómez M, Morales M, Fuerte R, Muñoz M, Delgado-López PD, Gómez-Cerezo JF, Casado E. Prevalence of Helicobacter pylori infection among patients with esophageal carcinoma. World J Gastroenterol 2024; 30(29): 3479-3487
- URL: https://www.wjgnet.com/1007-9327/full/v30/i29/3479.htm
- DOI: https://dx.doi.org/10.3748/wjg.v30.i29.3479


